|
Stabilizing beverage emulsions is a challenging task due to: • emulsions can be highly concentrated • variation in raw material quality • resistance to dilution • low viscosity Emulsion destabilization can also include size variation which will affect the taste and the long-term stability (or ‘ring’ formation), as well as particle migration (i.e sugar, pulp, proteins, etc). These phenomena may lead the consumer to consider the product as poor quality. Therefore, it is important to understand and enhance the stability of such products, to ensure the best customer perception and the conservation of flavour. Turbiscan Technology Applications Formulaction’s popular Turbiscan Technology can be used for a variety of applications, including the following: • Dairy products – quantifying and detecting characteristic destabilisation of milk-based products, determining droplet size variation, creaming of fat droplets, sedimentation of calcium or chocolate particles. • Flavour emulsion – the kinetics of coalescing without the necessity to dilute the sample. • Soft drinks – detection of ring formation, colour change, pulp/sugar/protein sedimentation. • Desserts – detect destabilisation phenomena of cream, dessert foam, ice cream, etc. • Raw materials – Rapid monitoring of the efficiency of stabilisers, thickeners, etc. In addition to these applications, this Turbiscan technology also has the following strengths: • The shortening of analysis times, which can be up to 200 times faster than a visual test. • Detect and quantify any type of destabilisation, e.g sedimentation, flocculation, creaming, agglomeration, size variation, etc.). • Use of the Turbiscan Stability Index (TSI) to enable quick comparisons of different samples, ranking of the samples according to stability. The higher the TSI, the lower the stability. • No dilution and non-intrusive analysis allows determination of real shelf life. • A temperature range from 4 °C to 80 °C. • An objective method with graphical and numerical data. • Quick screening of formulations. Summary Formulaction’s Turbiscan Technology has been used in over 1200 publications to date, and over 200 patents across more than 50 countries. Some of these include: • The Effect of Fat Content on the Creaming of Milk • Formulation of Chocolate Milk • Use of the Turbiscan for Measuring Foam Stability Properties of Food Ingredients. • Particle size and stability of UHT bovine, cereal and grain milks. • Impact of Weighting Agent and Sucrose on gravitational Separation of beverage Emulsions • Factors Affecting Initial Retention of Microencapsulated Sunflower Seed Oil/Milk Fat Fraction Blend. To find out more about the Turbiscan Technology and how it can help your research and development, please call us on: 01442 87677 or email: sales@fullbrook.com. We will also be happy to discuss your requirements further and provide a free no-obligation quote. 
0 Comments
Recently, the powder coatings market has seen significant growth, and is used across a wide range of industries. Normally, the powder coating process involves putting a coating on an item electrostatically, which is then cured by heat. However, this process is developing further due to: • The finish being harder and tougher than standard paint and guarantees an excellent chemical resistance. • These industries are searching for more eco-friendly and sustainable systems However, the nature of powder coatings means that you need to bear in mind special properties to avoid defects such as the orange-peel effect. How can the High Temperature Rheolaser Coating help? This new technology from Turbiscan can assist by: • Development of low energy curing formulations • Using greener ingredients that comply with environmental regulations and their impact on the curing process • Optimising the gel time by following the curing kinetics. How were the experiments in this study carried out? The experiments were all performed with the high temperature Rheolaser Coating on different powder coatings, using different temperatures and different experimental protocols. Based on an optical technology called Diffusing Wave Spectroscopy (DWS), the instrument uses a laser to illuminate the coating, whereby the photons travel through the coating thickness and interact with any scatterers. The different optical paths of the photons create interfered backscattered waves. This forms an image on the camera composed of light and dark spots and is referred to as a “speckle image”. When the coating presents important microscopic dynamics activity (liquid-like), the speckle image will be fluctuating, meaning some bright spots become dark and some dark spots become bright. The fluctuation speed is directly correlated to the scatterers motion and thus to the viscoelastic properties of the material. Using dedicated image analysis, it is possible to determine a characteristic frequency, the microscopic dynamics (μD or mD), which directly correlates to the speckle image fluctuation. For example, figure 2.a below shows a liquid sample going to dry/cure at an imposed temperature over time. 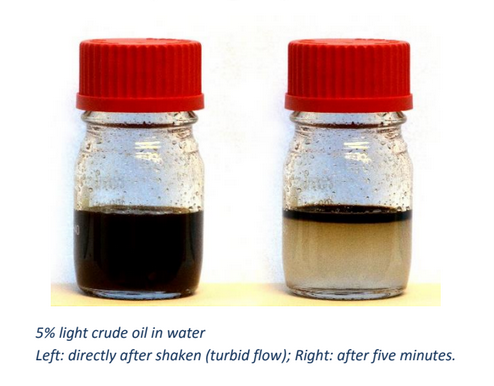 A high value of μD indicates fast speckle image fluctuation, corresponding to a liquid sample (fast scatterers motion). On the other hand, a low μD value is a sign of a slower evolution of the speckle image and solid-like behaviour. Therefore, it is possible to precisely monitor the curing kinetics of the coating. For powder coatings, during curing at an imposed temperature, the coating changes from solid to liquid to solid form, thus the scatterers mobility change. A μD value decrease means mobility decrease and vice-versa. It also possible to follow the microscopic mobility versus temperature during a temperature increase. A low value of μD indicates low speckle image fluctuation, corresponding to a steady state of the sample. On the other hand, a peak of mobility (μD) is a sign of a faster evolution of the speckle image, generally corresponding to phase transition (figure 2.b below). 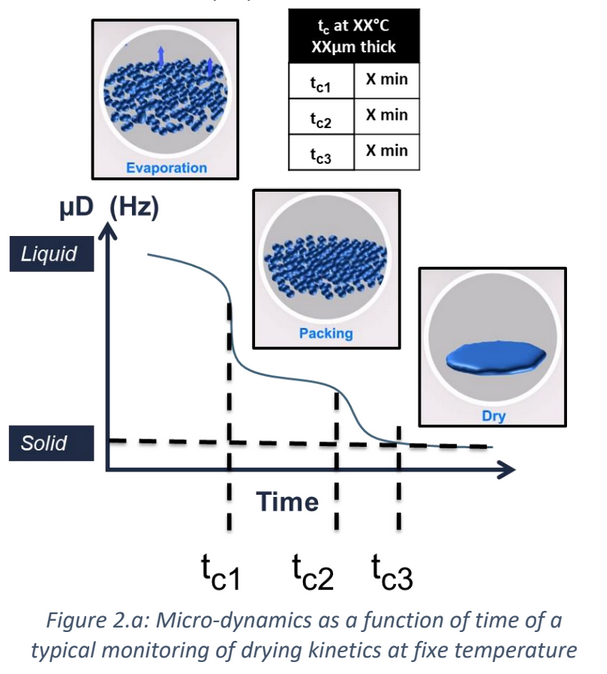 There is an example of powder coating microscopic mobility evolution versus temperature during a temperature increase in section one of the results below. What were the results of the experiments? 1. Detection of characteristic temperatures: Determination of the optimal curing temperature Figure 3 below shows the microscopic dynamics (mD) versus temperature. The sample is a 400μm thick white powder coating heated from RT to 250°C. The graph shows a clear identification of the different curing steps. 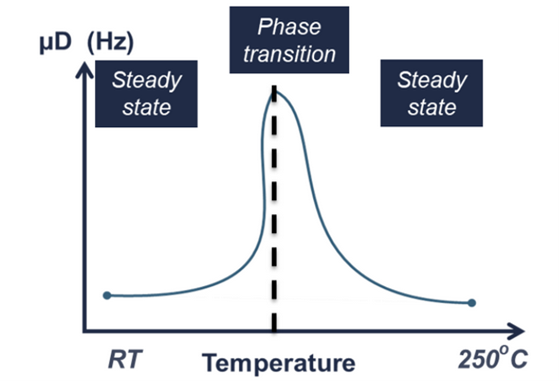 Around 50°C a first peak appears due to the mobility increase during the particle’s deformations. At around 80°C, the peak corresponds to the coalescence of the film. Starting from 125°C, the thermal energy allows the curing and the creation of the three dimensional thermoset network. After the curing and the film formation, an expected peak appears around 250°C. The final dynamics increase is due to the polymer decomposition. To verify the physical correspondence of the different pics (fig. 3), a visual inspection was done after different curing temperature (fig. 4). 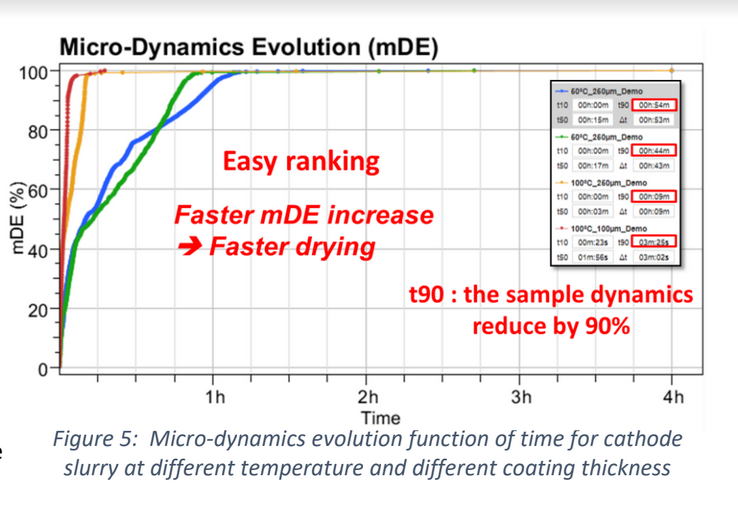 If the curing temperature is less than the decomposition temperature (200°C for example), the coating will form a smooth white film. But if the curing temperature is 250°C, the coating formed will be uneven and brown. Thus, from the microscopic dynamics (mD) versus temperature (fig. 3), it’s possible to determine the optimal curing temperature. 2. Detection of characteristic curing time and influence of the temperature on the curing process To go further and fine tune the results presented previously, the instrument allows the study of the microscopic mobility versus time at a fixed temperature. Figure 5 below shows the microscopic dynamics (mD) versus time for the same white powder coating discussed in section 1 at 125°C and 400μm thick. The inset image is a zoom on the first 5 minutes. 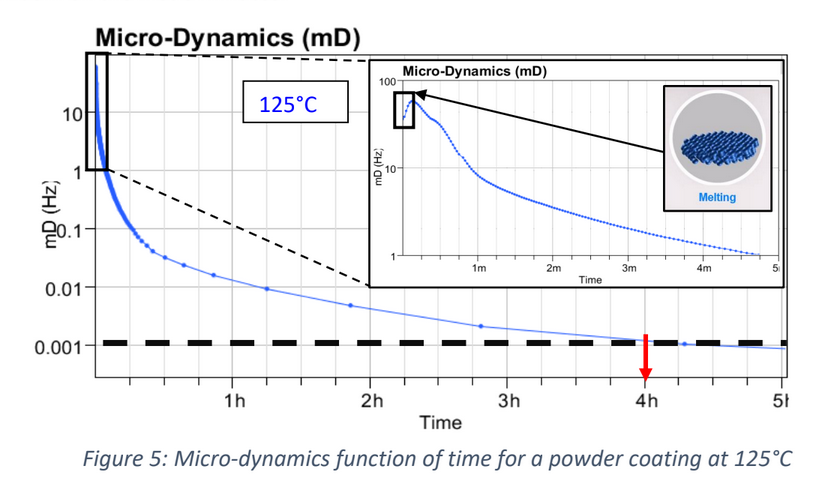 When the sample is heated to 125°C, the microscopic mobility increases (during ≈10s, inset fig. 5) because of the polymer melting. Then, when the polymer has melted, the curing starts, the three dimensional thermoset network forms and the microscopic mobility decreases. For this sample at 125°C, the microscopic mobility (mD) decreases, and achieves a plateau after around 4h. Looking more closely at this, figure 6 below shows the microscopic dynamics (mD) versus time for curing of the same sample, and same sample thickness, but at 3 different temperatures. The inset is a zoom on the first 5 minutes. 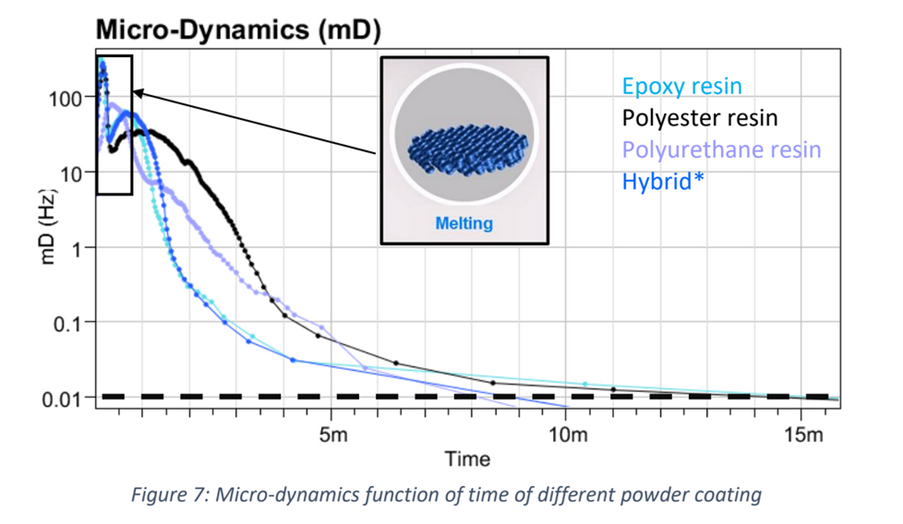 The inset of figure 6 allows a focus on the early stages (i.e. the first 5 minutes) of the curing. For the different curing temperatures, the mechanisms observed are qualitatively the same. Firstly, the microscopic mobility increases because of the polymer melting (for the first ≈10s). Then, when the polymer is melted, the curing starts, the three dimensional thermoset network forms and the microscopic mobility decreases. An interesting discrimination is detected later in the experiments at longer times (fig. 6). At 125°C the curing takes around 4h for this sample (blue curve). If the curing temperature is increased to 200°C ( green curve) takes around 1h to reach the same plateau level. So, by increasing the temperature from 125°C to 200°C, we can reduce the curing time from 4h to 1h, thus increasing the speed of manufacture. However, if the curing temperature increase continues (to 250°C, red curve fig. 6), the sample presents an expected increase of the mobility after 30 minutes. This is due to the polymer decomposition at this temperature, which confirms the result observed in section 1. Most importantly, this instrument allows the formulators to optimize the curing protocol. 3. Detection of characteristic curing time and the influence of the formulation on the curing process Figure 7 below shows the microscopic dynamics (mD) versus time for 4 different powder coating formulations: Epoxy resin, Polyurethane resin, Polyester resin and Hybrid. All the samples are applied at the same thickness (400μm) and analysed at the same temperature of 200°C. 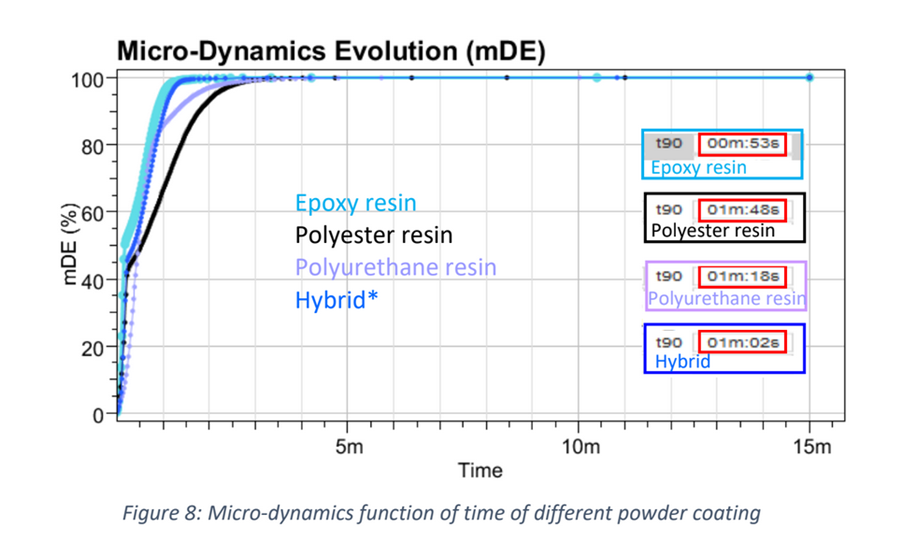 When the samples cure at 200°C, the microscopic mobility increases during the early stages because of the polymer melting. Then, when the polymer is completely melted, the curing starts, the three dimensional thermoset network forms and the microscopic mobility decreases. The graph above shows a clear difference between the different samples and the sensitivity of the technique. The instrument is also able to distinguish the curing kinetics an d the differences between the different formulations (i.e. different polymers or different additives). The software provides a smart way to rank the curing kinetics of different samples (or different curing temperatures, different polymers, different substates, different formulations, etc). Figure 8 below shows the microscopic dynamics evolution (mDE) versus time for the 4 different powder coating formulations.  This means we can easily rank the curing kinetics of the different formulations. The faster the microscopic dynamics evolution (mDE) increases the faster the curing. The software also gives a quantitative information corresponding to the time ‘t90’ (in the inset red boxes in Figure 8) where the sample microscopic mobility is reduced by 90%.
For these materials, the ‘t90’ is very close to the end of the melting time, and the start of the curing, due to the important change of the mobility at the end of the coalescence. The solution then allows you to compare, rank and screen different formulations. Conclusion In summary, the high temperature Rheolaser Coating offers a new in-situ, non-invasive and efficient method to better understand the different materials you work with. Allowing you to:
To find out more about the high temperature Rheolaser coating, please contact us on 01442 87677 or email us at: sales@fullbrook.com. In this post, we discuss how the Turbiscan Stability Index (TSI) from Formulaction can help you establish surfactant efficiency and emulsion stability. The objective of this study was to analyse the influence of various parameters on the stability of emulsions including surfactant choice, temperature and concentration, using the Turbiscan AGS and Tower as well as the TSI. What are emulsions? Emulsions are defined as unstable colloidal systems that may experience many destabilisation phenomena, such as flocculation, creaming, and coalescence, that can be caused by a variety of reasons, including lack of surfactant to stabilise the interfaces, and attractive forces, etc. This means that if you are formulating an emulsion, it is important to know the origins of these processes and how to overcome them, to achieve a stable final product. Due to the presence of small and big droplets, as well as chemical interactions - droplets tend to flocculate, although the addition of surfactants may minimise this problem. This study investigated how different surfactants influenced the flocculation of the droplets, as well as the effect of surfactant concentration and the storage temperature. What was the measurement protocol? An O/W emulsion was formulated using oil (triglyceride) , 1% xanthan, and one of two additional non-ionic surfactants with different lipophilic chains. These were Tween 80 (HLB 150 and Tween 65 (HLB 10.5). A reference emulsion was also studied, with no additional surfactant present. How were the destabilisation phenomena detected? Using the Turbiscan technology, destabilisation phenomena were detected in these formulations, showing evidence of pure coalescence in the samples without any droplet migration. How were the phenomena quantified? The TSI can monitor the coalescence kinetics in the samples versus ageing time. It does this by adding up all the variations detected in the sample (size and/or concentration). At any given ageing time, it was found that the higher the TSI, the more inferior the stability of the sample. The effect of both surfactants can be compared to the reference, which showed that Tween 65 has no influence on the stabilisation of the coalescence in this sample, as its HLB is not high enough to play a stabilising role. This is compared to Tween 80, which significantly decreases the kinetics of coalescence. This means that to increase the stability of the emulsion, surfactant Tween 80 must be added to this formulation. However, it’s important to remember that the surfactant is an expensive part of the final product, and the global stability is not proportional to the amount of surfactant. As a next step, we then need to identify the optimal amount of surfactant to achieve the best stability for the lowest price. How was this determined? An analysis was made with a 0%, 0.5%, 1% and 2% of surfactant, and the TSI was computed for each formulation after 1 day of ageing. The results showed that the optimum amount of surfactant for this particular formulation is 1%. The TSI was similar for the 2% of surfactant, which shows that increasing the upper limit beyond 1% is unhelpful for stability and increases the cost for no reason. Summary The Turbiscan allows the qualification of the best surfactant for a given emulsion to minimize the coalescence rate. This is possible in all types of concentrated dispersions without dilution, by comparing different formulations and optimising the best one. The Turbiscan also provides a unique tool for monitoring the kinetics of system destabilisation, and quantifying it accurately after identifying the phenomena.
|
C HumphreysOctober 2016 Fullbrook Systems Ltd move to new premises in Hemel Hempstead. After being in the same offices for many years the company moved to more suitable premises Archives
February 2023
Categories |
 RSS Feed