|
The Turbiscan® Stability Index from Formulaction offers fast, robust, and objective quantifying of sample evolution over time in one single click. Since its introduction, the TSI is fast becoming the main criteria used to compare sample stability evolution, and is now extensively used in research and development, quality control and academic research. In this blog post, we look at the following: - How significant is the TSI value? - Which value allows to consider the sample stable? - How much different are the samples in terms of global physical stability? Using Formulaction’s vast experience (over 25 years) with stability and particle size characterization, and the knowledge of the static multiple light scattering (S-MLS) technology, it is possible to correlate the TSI value with a visual observation for better analysis of the TSI values and moving towards the stability prediction. What is the TSI? The Turbiscan® Stability Index is a dimensionless number gained by adding together all occurring destabilization phenomena in the sample that can be measured by noticeable change of the backscattering or transmission signal intensity along the sample height. These signal variations are directly linked to any destabilization in the sample, meaning that the higher the TSI value, the lower the stability. How was the TSI scale developed? Although the TSI provides a fast, efficient, and robust number for sample comparison, questions remain about the intensity of the destabilization and correlation with visual observation. During Formulaction’s 25 years of experience in characterising liquid dispersions and colloidal systems, they have gathered a significant amount of stability measurement test results achieved with the Turbiscan that could be correlated with visual observation methods. Their database contains thousands of samples of various types that their customers work with. These are both low and high concentrations, from nm to μm particle sizes, as well as emulsions and particle suspensions, and covers most of the application fields, including cosmetics, paint and coatings, food and beverages, dairy products, pharmaceutical injectable formulations, oil and lubricant emulsions. From this large database, a TSI scale has been set to correlate a TSI number with destabilisation intensity and correlated to visual observation. How does the TSI scale work? While the TSI is a dimensionless number, it is a function of time. However, the time of calculation is not to be ignored when ranking samples. TSI values should be compared at the same aging time. Once the TSI value, corresponding to a given state of destabilization, is calculated, the series of samples can be ranked and compared. The values are associated with a colour that allows for a direct analysis and sample validation, and can be seen below in the graph. 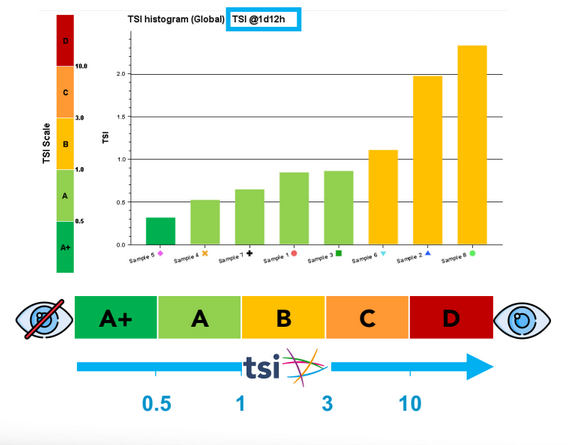 Where A+, A, B, C, and D correspond to the following key:
How can you adjust the TSI scale? The Turbiscan LAB, Turbiscan TOWER and Turbiscan AGS are all equipped with the latest software version, where the TSI scale can also be represented as a bar chart. The TSI scale colour code is displayed on the LCD screen of the Turbiscan TOWER. Since the sample validation may vary from one sample type to another, it is possible to adjust border values of the scale in order to optimise the visual validation. For example, in oil fields an emulsion may fail the stability requirements at TSI >10, while for a vaccine, maximum acceptable TSI may not exceed 2.5. Therefore, in these cases it is possible to adjust the values for more specific analysis. The TSI scale is based on the TSI Global. Conclusion The Turbiscan scale combines its benefits, such as the detection of early-stage destabilisation, non-disruptive measurement, real stability measurement, and Formulaction’s 25-year experience in measuring stability. It correlates the TSI value with visual observation to allow even easier comparison with previous methods and helps with defining stability criteria for stability comparison and stability prediction. Turbiscan is a unique tool providing full characterization of your formulation with an extremely wide range of applications, including electronics, polymers, raw materials, pharmaceuticals, food and beverages, agrochemicals and paint and inks. For more information on how the TSI can assist with your own research, development and/or production, please call us on: 01442 876777 for a free, no obligation quote, or email us at: sales@fullbrook.com.
0 Comments
The methods, applications, and benefits of the Kemtrak DCP007 include the following:
• ICUMSA Methods GS 1/3-7, GS 2/3-10 and GS 2/3-10 • Determination of the solution colour of white, brown, and raw sugars as well as coloured syrups • Decolourisation of glucose syrups • A charcoal filter alarm • Manufacturing quality and control • Real time in-line continuous measurement • A zero maintenance LED light source that never needs replacing. What is the ICUMSA Colour Scale and how is it used in sugar production? The International Commission for Uniform Methods of Sugar Analysis (ICUMSA) describes a range of methods for the colorimetric determination of filtered sugar suspensions at known concentrations (Brix values). The ICUMSA colour scale is used to measure the grade and quality of the sugar. The colour of sugar directly relates to the degree of refining – raw sugars being dark brown in colour whilst highly refined sugars are white in colour. The ICUMSA colour scale is a measurement of the yellowness of the sugar resulting from residual molasses not removed in the refining process and can be used to monitor and control the manufacturing process. How can the Kemtrak DCP007 be applied to this process? The Kemtrak DCP007 process photometer has a high-performance long-life LED light source, precision optical filters and robust fibre optics that results in an ICUMSA colour analyser with outstanding performance and reliability. The Kemtrak DCP007 process photometer is recommended to accurately measure ICUMSA colour. The Kemtrak DCP007 employs proprietary dichromatic measurement technology that compensates for particulates, allowing accurate colour measurement without the need for filtration. Due to the proprietary dichromatic four channel measurement technology, particulates in the process media can be compensated for in real time providing an accurate measure of colour without the need for filtration. A primary “absorbing” wavelength then accurately measures colour changes in the process medium, while a second reference wavelength, which is not absorbed by the process medium, compensates for particulates and/or fouling of the optical windows. Since optic fibres are used to transfer light to the measurement point and back, the measurement cell contains no electronics, moving parts or sources of heat that result in condensation on the optical surfaces. Standard measurement cells are machined in sanitary grade stainless steel with sapphire windows. How should I set up and configure the Kemtrak DCP007 for my own work? ICUMSA recommend the absorption of light at 420nm for white and light-coloured sugars and 560nm for darker sugars. 720nm is recommended for the reference wavelength to measure and compensate for the turbidity of the solution. The Kemtrak DCP007 process photometer will accurately measure ICUMSA colour for a known concentration sample using the Brix value (degrees Brix or °Bx). ICUMSA colour is calculated as follows: ICUMSA Colour = 1000 × As/b c Where: As = absorbency of the solution (DCP007 primary measurement) b = the optical path-length (cm) c = concentration (g/mL) (using the Brix value). Colour score is expressed in RBU (reference base units) per ICUMSA standard method(s). Where an end user specific base reference is used, the DCP007 can be adjusted accordingly. The process Brix value, measured using a separate density or refractive index analyser, is input into the Kemtrak analyser through a 4-20mA analogue input to correct for differences in sugar concentration. As an alternative where a live density measurement is not available, process Brix values can be manually entered into the analyser. The Kemtrak DCP007 should be configured for the desired measurement range for maximum resolution and accuracy. An optical path-length of at least 10 cm or more is recommended for low colour white sugars, whilst shorter path-lengths are necessary for darker sugars. Please contact us directly for specific configuration details regarding measurement wavelength and selection of optical path-length for the desired measurement range. Where can I find out more about the Kemtrak DCP007? Head over to our dedicated webpage on the Kemtrak DCP007 for more information on this popular instrument. To discuss your requirements or for a free, no-obligation quote, please call us on: 01442 876777 or email: sales@fullbrook.com. |
C HumphreysOctober 2016 Fullbrook Systems Ltd move to new premises in Hemel Hempstead. After being in the same offices for many years the company moved to more suitable premises Archives
February 2023
Categories |
 RSS Feed