|
Beer, one of the oldest beverages produced by humans, appeared as early as 5,000 years ago, and is one of the most widely consumed alcoholic drinks in the world, only surpassed by tea and water. Produced by the brewing and fermentation of starches, it is a complex beverage, containing a diverse mixture of carbohydrates, proteins, and aroma compounds. Unlike other manufactured beverages that can be easily fine-tuned by either adding or removing ingredients, the natural fermentation process cannot be so easily changed to achieve precise ingredient concentrations. Instead, raw ingredients and processing parameters, such as time and temperature, must be carefully adjusted to achieve the required stability and sensory profile. Unfortunately, Formulaction’s Turbiscan wasn’t developed until 1994 to help brewers adjust the stability of their beers and easily estimate shelf life and other quality parameters, such as sedimentation and clarity. The Turbiscan can be used to quantitatively predict sedimentation of yeast and proteins, haze stability, flocculation, clarity, and foam stability, all of which are key parameters for many beer types. How does the Turbiscan work? The Turbiscan® technology, based on Static Multiple Light Scattering, works by sending a light source (880nm) in to a sample and acquiring backscattered (BS) and transmitted (T) signals over the whole sample height. By repeating this measurement over time, we are able to monitor physical stability. The signal is directly linked to the particle concentration and size by the Mie theory. The Turbiscan and TSI are ‘must have’ tools for formulators for fast and quantitative measurements of stability. The Turbiscan technology has now been used for decades by formulators for stability measurements and is now recognised as a standard technique for direct stability analysis. How was the study carried out? The Turbiscan can be used to quantitatively predict sedimentation of yeast and proteins, haze stability, flocculation, clarity, and foam stability, all of which are key parameters for many beer types. In this blog post, we will highlight the utility of the Turbiscan for analysing beers at all stages of the brewing process for raw ingredient analysis, optimization of processing parameters, and rapid shelf-life determination. “Hazy” IPA stability analysis Hazy IPAs have gained significant popularity in recent years and represent a new and exciting trend for craft and large breweries. These beers are characterised by their hazy appearance that is similar to orange juice, with a taste profile that is usually quite fruity. These types of IPAs are especially prone to sedimentation due to their high turbidity (proteins, and for optimal consumer experience, the haze should be stable in a variety of storage media (cans, bottles, or kegs) at given temperatures. The early stages of this destabilization phenomenon can be detected using the Turbiscan (Figure 1). 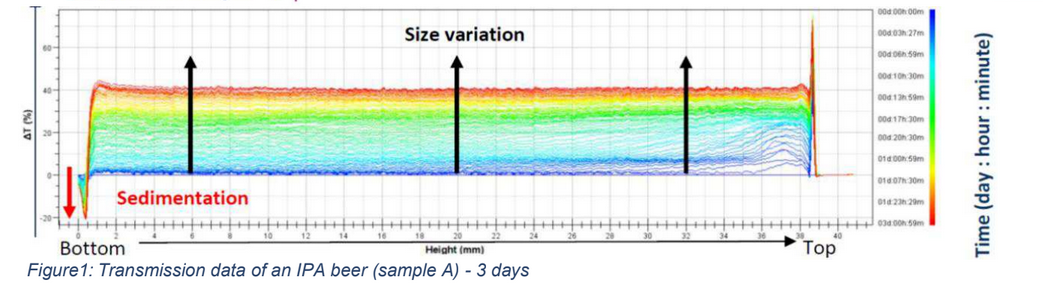 From the Turbiscan data obtained (please see Figure 1) over three days, multiple destabilisation phenomena can be detected. At the bottom of the sample vial (left side of the scan) there is a sharp decrease in transmission, indicating sediment formation. A nearly global increase in %T is also observed, indicating particle size variation - flocculation. Analysis using Turbiscan software (Turbisoft) shows the flocculation kinetics of various hazy IPAs (Figure 2) allowing us to compare different profiles and evaluate the kinetics. 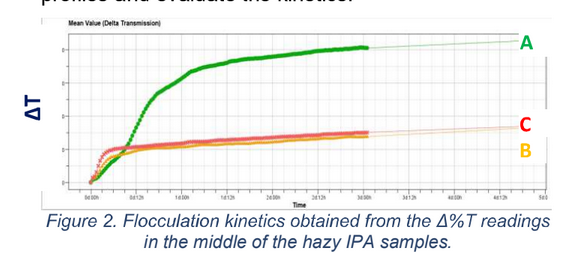 Samples A, B, and C were of the same beer, but samples came from different batches. From this data, the stability of the batch obtained on day A was significantly lower than other batches (days B and C). The Turbiscan helped the brewery to quickly identify the root cause of the destabilisation. In addition to monitoring changes over time to predict beer stability, initial clarity can be swiftly determined using the Turbiscan (Table 1). 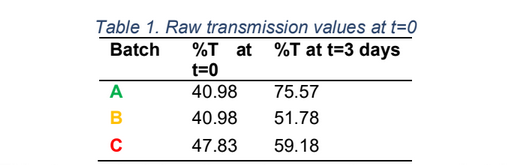 As different beers will vary in their clarity, criteria can be established for acceptable initial raw transmission value (at t=0) as a method for assessing initial quality. This type of data allows brewers to assess batch stability in a fraction of the time compared to a subjective visual test. With changing consumer tastes, it is important to have the flexibility to modify ingredients and develop new brews while ensuring stability and performance are maintained.
How were the quality parameters monitored during the brewing process? Process parameters must be carefully adjusted and maintained to achieve the desired properties. By determining the optimum time and temperature for each step in the process, energy and time needed can be reduced. The Turbiscan can be used to assess quality parameters even at early stages of the brewing process. One example of this is the analysis of wort clarity and the influence of processing temperature. Wort is the mother liquor and the Turbiscan can be used to monitor the clarification, and determine clarification kinetics at various temperatures. A short 10-minute test allows the identification of the differences between the sample behaviours. By plotting the change in transmission over time, the Turbiscan can help to analyse clarification kinetics at different temperatures. By rapidly determining the rates of clarification in small test batches, the conditions can be optimized for mass production. What are the properties of beer foam? Beer foam, also known as the head, is formed from the naturally produced carbon dioxide during fermentation. Beer foam can significantly affect the sensory experience and imparts a creamy quality with a sense of fullness. Certain hydrophobic proteins are known to increase foam stability, providing a longer softening effect on the palate. However, ethanol can inhibit foam formation. Several types of beers were studied regarding foam formation over time. Unsurprisingly, the beer with the lowest alcohol content (E) produced the most stable foam, only decreasing to 20% of the original volume after 400 s. At the same time, beer F showed good foam stability for its moderate alcohol content. Also, when compared to Beer B, which contained the same amount of alcohol but had lower foam stability than beer F, we can see that the use of a different container can have an impact on final foam quantities. Looking more closely at the Turbiscan data, the drainage kinetics of the foam can be plotted alongside the growth of the liquid layer. Since the Turbiscan measures the backscattering and transmission simultaneously, information on both the foam (backscattering) and beer (transmission) can be obtained from a single scan or series of scans without having to switch reading modes. This means the Turbiscan can be used to obtain detailed kinetics of foam stability and allow the brewer to adjust the beer to achieve the desired characteristics. This study demonstrates the capability of the Turbiscan to characterise beers and optimise brewing parameters. The results provide accurate, quantitative data for beer stability analysis and removes the estimation associated with visual stability observations. This high-resolution analysis can accelerate the stability analysis timeframe from many days or weeks to a couple hours for rapid shelf-life determination. In turn, this helps move projects to completion at a much faster rate than traditional methods. The Turbiscan has proven to provide fast and accurate results that can be applied to all types of beers, including traditional varieties and emerging trends such as hazy IPAs. For more information and advice on how the Turbiscan can be used to characterise beer stability, and help improve your own formulations, please contact us on: 01442 876777 or email: sales@fullbrook.com.
0 Comments
In this week’s blog post, we look at the quality control of raw materials in the cosmetics industry, and how the Turbiscan Classic can be used to assess this. Formulation development is a vital activity for many industries, including pharmaceuticals, paints, and coatings. As sales of formulated products amount to approximately £180 billion per year in the UK, getting formulations “right” is a crucial and valuable goal. Stability is a crucial attribute for many products with a direct impact on performance, shelf-life, kerb appeal and ultimately, worth. A systematic approach to understanding and developing stability can therefore be extremely helpful in improving the likelihood of success in long term stability trials, and accelerating formulation. Part of this process depends on the quality of the ingredients. This is because the nature and the quality of a constituent in a formulation may influence its stability. As a formulator, you need to test the stability of your emulsions, suspensions, and foams with different types of raw materials. When dealing with natural products, the difference in quality can be more noticeable when moving from one supplier to another. To examine this, the effect on the stability of two cosmetic emulsions via the introduction of Jojoba oil from different suppliers was analysed using the Turbiscan Classic. How was the study carried out? Two kinds of emulsion, a Sport lotion and a Sensitive lotion were prepared with Jojoba oil from different suppliers: • with oil noted 1 • with oil noted 2 Samples number: 4 Analysis volume: 6 ml Temperature of analysis: 43°C Analysis Duration: 24 hours Two hours were needed to bring the samples to the required temperature (43°C). The curve after 2 hours of analysis was selected as a reference. The subsequent traces show the changes in back scattered light intensity (%, y-axis) on the tube height (mm, x-axis) as a function of time (the last curve is always displayed in red). What were the results of the study? The profiles obtained show different kinds of backscattering change: • NO significant backscatter change at the top of the samples prepared with oil 1, characteristic of no change in this zone (please see Figure 1 below). • a backscattering decrease at the top of the samples prepared with oil 2, characteristic of a clarification of the samples in this zone (please see Figure 2 below). 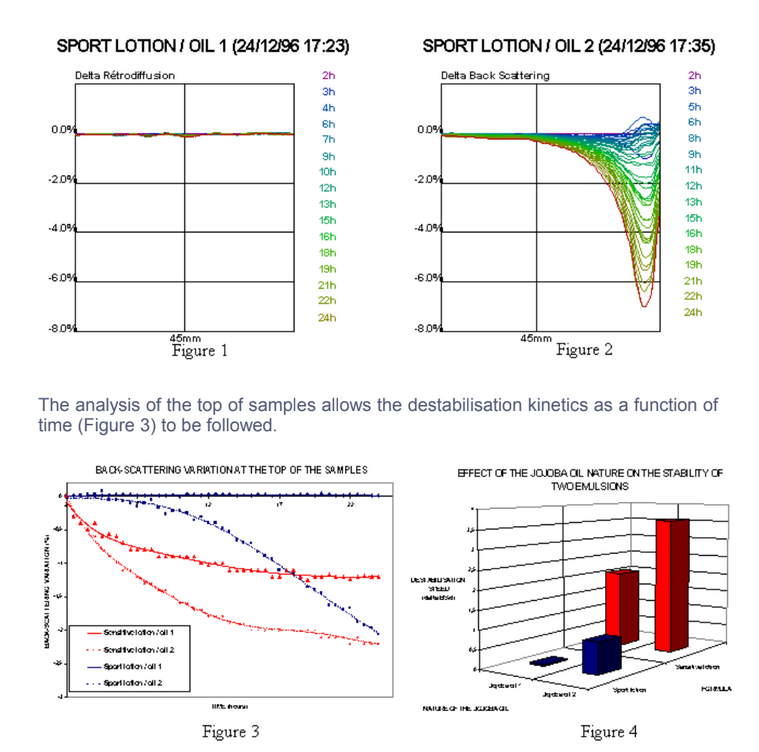 The calculation of the slope of the graph over 12 hours allows the calculation of the destabilisation speed as a function of the Jojoba oil type used (Figure 4).
The jojoba oil 1 used in both formulations made more stable emulsions than Jojoba oil 2. This quality difference can be explained by the different oil extraction methods employed by the different suppliers. In conclusion, the Turbiscan range can detect particle migration phenomena in a few hours and allows for a quantitative comparison of the results to be made for each sample. It is, therefore, a useful tool for those formulators looking to study the effect of raw material variation on their samples. For more information about the Turbiscan and how it can help your own formulations, please email: sales@fullbrook.com or call: 01442 876777. In this week’s blog post, we discuss how Kemtrak’s popular photometer can be used to improve the efficiency of chromatographic separation processes. What are chromatographic techniques? Chromatography is widely used in bioprocessing to separate protein molecules from concentrated process fluids. The centre of a chromatography system is a column, filled with a media specific to the separation being carried out. The versatility and efficacy of chromatographic techniques have made them a crucial part of both large scale and analytical separations. The current methods of chromatographic separation are as follows: Gel filtration – refers to sorting the material by molecular size. The physical dimensions of the molecule determine the separation because proteins are naturally spherical. This means the molecular weight of the protein will be proportional to its size, allowing for separation based on this property. Larger molecules pass more slowly through the column media, while smaller molecules pass through more quickly. Ion exchange – refers to sorting the material by electrical charge. Separation works by opposite charge attraction and like charge repulsion. Using a specific charge within the column media allows for attraction and binding of the molecule(s) of interest. Hydrophobic interaction – refers to sorting the material by degree of Hydrophobicity. Separation relies on polar (hydrophilic) molecules “sticking” together and repelling those which are non-polar (hydrophobic). Affinity - this method uses a bio-specific binding site. This is a section of a molecule in which the shape and distribution of charged and hydrophobic groups allow for highly specific binding to a corresponding site on another molecule. The fit between the two sites is analogous to a lock and key. How does chromatography work? Chromatography is a process for separating components of a mixture. To start the process, the mixture is dissolved in a substance called the mobile phase. This then carries it through a second substance called the stationary phase. The different components of the mixture travel through the stationary phase at different speeds, causing them to separate from one another. The nature of the specific mobile and stationary phases determines which substances travel more quickly or slowly, and this is how they are separated. These different travel times are known as retention times. A chromatography gel is designed to have one half of this lock and key (the ligand), making it stationary within the column. As the product solution is passed through column, the specific mating molecules are bound in place until they are eluted from the column. Examples of affinity interactions include the binding between antibodies and antigens, and enzymes and substrates. The molecular properties utilised in chromatographic separation can be seen in the figure below: 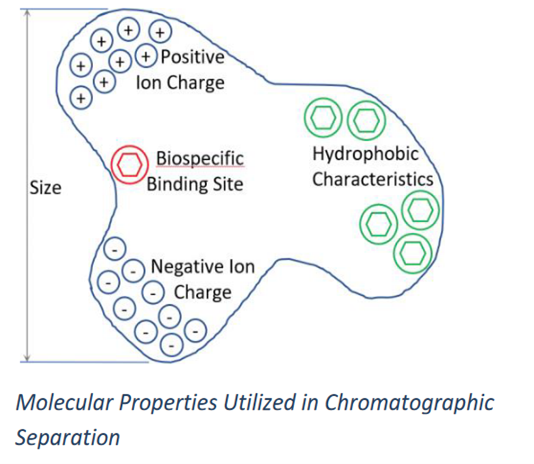 Separation through chromatography requires highly specialized equipment to ensure maximum yield and purity. A system may include a variety of instruments and sensors for pre - and post - column control.
Nearly all proteins absorb UV light at 280 nm, the primary reason for this is due to the aromatic amino acids, e.g. phenylalanine, tryptophan, tyrosine, and histidine. How does installing a Kemtrak DCP007 help improve chromatographic processes? Installing a Kemtrak DCP007-UV photometer, measurement cell at the column outlet, allows the presence of proteins to be detected, and therefore collection/pooling to begin. It is vital that any UV analyser has no dead or hold up volume to ensure crisp, sharp peaks are detected. UV analysers utilizing measurement cells with internal hold up volumes can lower the purity of the collected protein because of dilution. Dilution blurs sharp peak detection lines, and can cause lower yields. Using a Kemtrak DCP007-NIR photometer, mounted pre-column to determine solvent concentration/composition, allows for a feedback control of the solvent “mobile media” feed through the column, and increases the accuracy and repeatability of the chromatography system. With the unique zero dead volume Kemtrak measurement cell installed, the Kemtrak DCP007 analyser can provide single or dual wavelength absorbance analysis, in real time, for improved control of the chromatographic separation processes. Therefore, the Kemtrak DCP007 is the recommended analyser for chromatographic separations. To find out more about the Kemtrak DCP007 (UV or NIR) Photometer, please visit our website: or call: 01442 87677 to discuss your requirements further. We will also be happy to provide a free, no obligation quote. |
C HumphreysOctober 2016 Fullbrook Systems Ltd move to new premises in Hemel Hempstead. After being in the same offices for many years the company moved to more suitable premises Archives
February 2023
Categories |
 RSS Feed