Rheolaser Coating: An Innovative Solution For Optimising Paints, Inks & Coatings Formulations24/3/2022 The use of paints, inks, and coatings across a wide range of industries has continued to grow over recent years, driven by high demand from the automotive, electronics, construction and aeronautics industries. Both water and solvent borne formulations continue to be challenged to provide more competitive and environmentally friendly materials. Those working in the industry are often searching for new, original formulas that use more sustainable materials. This means we need to look closely at controlling the characterisation of these innovative formulations. The main benefits of applying Formulaction's Rheolaser Coating to these processes are: • Formulating and reformulating biocompatible and solvent free solutions • Gaining precise knowledge and understanding of formulations, including drying kinetics, drying steps, etc. • Evaluating the impact of the formulation ingredients, and film formulation parameters, i.e. Temperature, Humidity, Substrate, Film Thickness, etc. • Determining the optimal drying protocol time, such as time and temperature. How was the study carried out? The experiments were performed by Rheolaser Coating High Temperature on a bi-component epoxy adhesive at different temperatures. The Rheolaser Coating high temperature measurement is based on an optical technology - Diffusing Wave Spectroscopy (DWS). This is where a laser illuminates the coating, and the photons travel through the coating thickness and interact with the coating's scatterers (Particles, Droplets, Polymers, etc). The different optical paths of the photons create interfered backscattered waves forming an image on the camera composed of bright and dark spots = Speckle Image.  When the coating undergoes important microscopic dynamic activity (liquid-like), the speckle image will be fluctuating, some bright spots become dark and some dark spots become bright. The fluctuation speed is directly correlated to the scatterers motion and thus to the visco-elastic properties of the material. Thanks to our dedicated image analysis, it is possible to determine a characteristic frequency, the microscopic dynamics (μD or mD), which directly correlates to the speckle image fluctuation. For example, figure 2.a below shows a liquid sample drying / curing at a fixed temperature over time. A high value of μD indicates fast speckle image fluctuation, corresponding to a liquid sample (fast scatterers motion). On the other hand, a low μD value is a sign of a slower evolution of the speckle image and solid-like behaviour. Therefore, it is possible to precisely monitor curing kinetics of the coating. 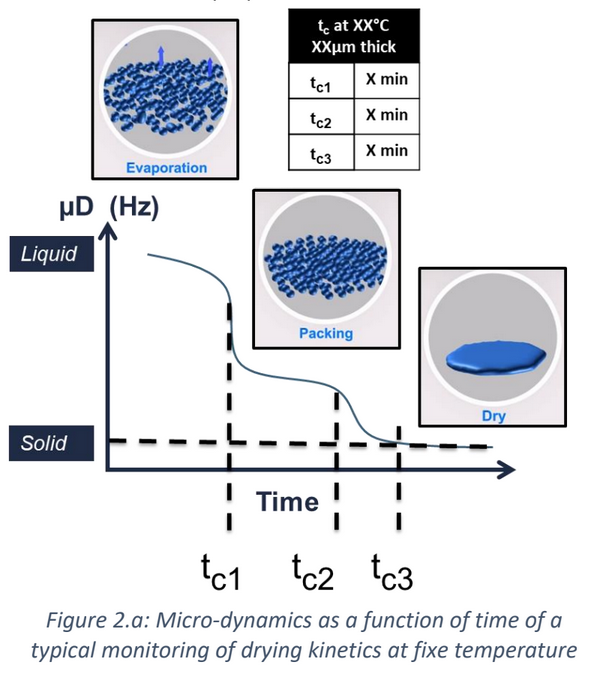 For powder coatings, during curing at an elevated temperature, the coating changes from solid to liquid to solid form, thus the scatterers mobility change. A μD value decrease means that the mobility decreases and vice-versa. Examples of these can be found further down in this post. It also possible to follow the microscopic mobility versus temperature during a temperature increase. A low value of μD indicates low speckle image fluctuation, corresponding to a steady state of the sample. On the other hand, a peak of mobility (μD) is a sign of a faster evolution of the speckle image, generally corresponding to phase transition (figure 2.b).  What were the results of the study? 1. Determination of the different drying steps and characteristic times Figure 3 below shows the microscopic dynamics (mD) versus time for a 100 μm thick technical paint sample at 90 °C. The graph shows a clear identification of the different drying steps (i.e. Evaporation, Packing, Drying) and allows us to determine the characteristic times (Open Time, Tack-Free, Dry-Hard, Dry-Through). For this sample, at 90°C and for 100μm thickness, the evaporation stage takes 1 minute (the open time), the packing finishes after 6 minutes and the sample is completely dry after 9 minutes (dry through). In conclusion, the instrument allows us to determine the different drying steps and characteristic times from Room Temperature up to 250°C. 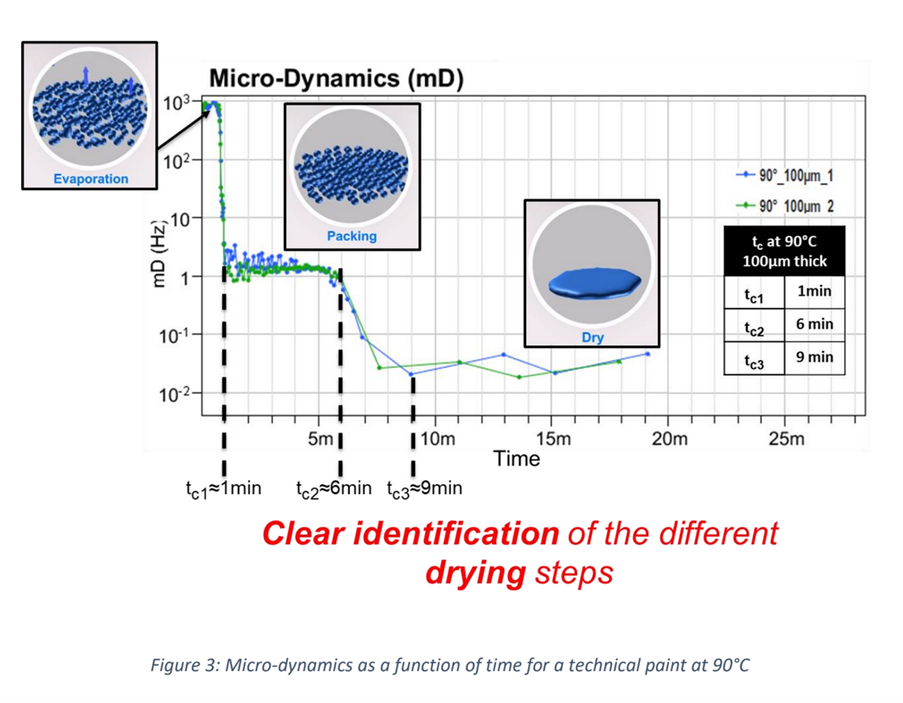 2. Determination of the influence of humidity and temperature The instrument also allows the exploration of the differences in the drying kinetics between different formulations or at different drying conditions (e.g. Temperature, Humidity, Thickness, Substrate Porosity, etc). Figure 4 (below) shows the drying kinetics of the same technical ink under different drying conditions. This includes the same temperature but at varying humidity (as shown by the red and blue curves) and the same humidity but at different temperatures (as shown by the blue and pink curves). 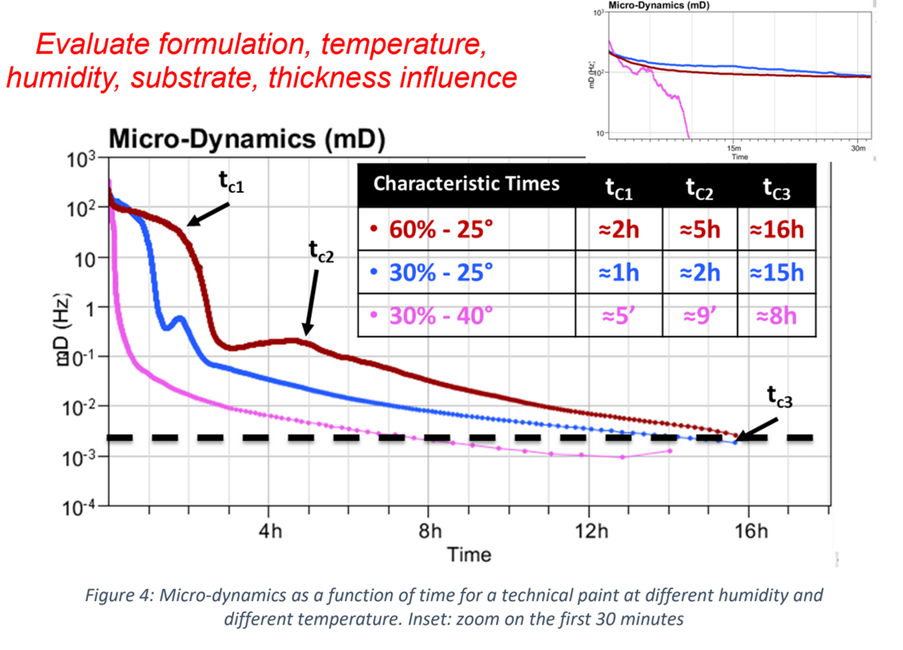 For all the experimental conditions, the instrument allows the identification of the different drying steps (i.e. Evaporation, Packing, Drying, etc.) and to determine the characteristic times, as displayed in the table inset (tc1 = Open time, tc2 = tack-free, tc3 = dry-through). At the same temperature (30 °C), the increase of the humidity (from 30% to 60%) slows down the drying kinetics (blue and red curves) and at the same humidity (30%), the increase of the temperature (from 25°C to 40°C) accelerates the drying kinetics (blue and pink curves). The instrument is sensitive to the temperature and humidity influence on the drying kinetics. In conclusion, this solution allows formulators to optimize the drying protocol and processes. Due to its specific functionalities, the software also allows us to easily rank the drying kinetics of different formulations, temperatures, humidity, thicknesses, and substrates. Therefore, the faster the microscopic dynamics evolution (mDE) increases, the faster the drying. 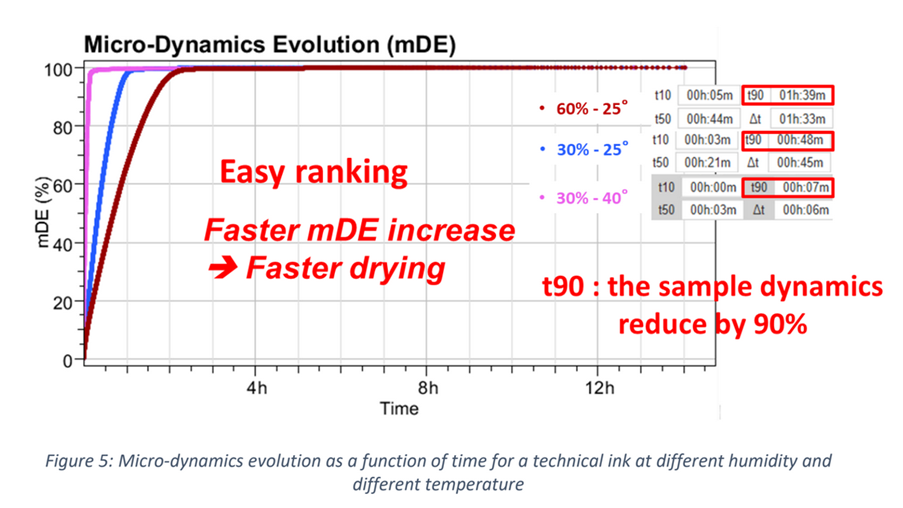 Figure 5 above shows the microscopic dynamics evolution (mDE) versus time for a technical ink at different humidity and different temperature. The pink curve, at 40°C and 30% humidity, shows the fastest mDE increase, so the drying is the fastest. The red curve, at 25°C and 60% humidity, shows the slowest mDE increase, so the drying is the slowest under these conditions.
Here, the variable parameters were temperature and humidity, but it is possible to vary the formulation ingredients, the thickness, and the substrate. The software also provides a quantitative information, the time ‘t90’ (seen in the red boxes, inset fig. 5). The ‘t90’ corresponds to the time when the sample’s microscopic mobility is reduced by 90%, “90% dried”. The ‘t90’ is extremely useful for a wide range of applications where there is a need to optimize the process and determine when microscopic mobility reduces by 90%, so it is then possible to start the next processing step. For some formulations, the ‘t90’ is associated with the ‘open time’. In conclusion, this solution allows the formulators to compare, rank and screen different formulations and drying conditions. Conclusion Formulaction’s Rheolaser Coating offers a new in-situ, non-invasive and efficient method to better understand different materials, allowing formulator’s to: • Monitor and know precisely the curing and drying kinetics • Determine the characteristic times of the film forming process • Analyse from room temperature up to 250 oC with humidity control • Evaluate the impact of the formulation, including the temperature, the thickness, the humidity, the substrate • Optimize the manufacturing protocol. Other key benefits of this new technology include: • Objectivity and accuracy in monitoring the curing/drying • The option of performing analysis on any type of substrate • Enables both temperature and humidity control • Provides in-situ and contactless measurement • Sensitivity to mobility at the nanometer scale. For more information about the Rheolaser Coating, please call us on 01442 876777 or email us at: sales@fullbrook.com.
0 Comments
Formulaction’s Rheolaser Coating: Innovative In-Situ Monitoring Of Battery Slurries Drying18/3/2022 Maintaining sustainable growth while preserving natural resources is one of the biggest challenges the world currently faces. It is predicted that by 2040, we will be using 30% more energy than we are today, which will require constant technological advances in battery production. The battery market is expected to see substantial growth over the next few years due to: • A booming global automotive industry • Growing demand for energy storage systems and UPS systems • Growth of the electric vehicle market • Increased applications in the industrial motive sector • Growing consumption of rechargeable batteries in consumer electronics. This means there is an increasing need for those working in this field to be innovative and create new solutions that can keep up with the pace of change across all these sectors. What are the stages involved in battery production? The battery production process can generally be broken down into the following steps: 1. Precursor formation 2. Chemical conversion of precursor 3. Electrode slurry preparation 4. Electrode manufacturing 5. Cell assembly 6. Cell formation and testing. Each step is vital for the final performance and should be well characterized, optimized, and verified. Over the last few decades, innovation in this field is constantly increasing. The development and the improvement of battery efficiency we see today is due to innovative new materials and fabrication process. Therefore, the characterization of these materials is a key step to: • optimize performance • understanding the differences between materials • acquiring the application knowledge for the process Overall, there are three main aspects that should be controlled: 1. The stability: the best powder-liquid dosing accuracy accounts for superior process stability and constant slurry properties and avoid batch-to-batch variations. 2. Rheological proprieties of battery slurries: tweaking the rheological behaviour of battery slurries by adjusting the operating parameters without making any changes to the slurry formulation. 3. The film formation process: after slurry application on the electrode foil, determining the best drying protocol (time, temperature) to optimize the battery’s features and production. How was this study carried out? The experiments were performed by Rheolaser Coating high temperature on NANOMYTE BE-45 (NCA) slurry, Lithium Nickel Cobalt Aluminium Oxide powder from NEI Corporation. The Rheolaser Coating high temperature measurement is based on an optical technology called Diffusing Wave Spectroscopy (DWS). A laser illuminates the coating, the laser photons travel through the coating thickness and interact with the coating's scatterers (particles, droplets, and polymers). The different optical paths of the photons induce interfered backscattered waves forming an image on the camera composed of bright and dark spots = Speckle Image. When the coating presents significant microscopic activity (liquid-like), the speckle image will be fluctuating, some bright spots become dark, and some dark spots become bright. The fluctuation speed is directly correlated to the motion of the “scatterers” and thus to the visco-elastic properties of the material. With dedicated image analysis, it is possible to determine a characteristic frequency, the microscopic dynamics (mD), which directly correlated to the speckle image fluctuation. A high value of mD indicates fast speckle image fluctuation, which corresponds to a liquid sample (fast particle motion). However, a low mD value is a sign of a slower evolution of the speckle image and indicates solid-like behaviour. With this technology, we can also precisely monitor film formation and drying kinetics of the coating. During drying or curing steps, the coating changes from liquid to solid form, meaning the viscosity and elasticity increase significantly. As a result, both particle mobility and speckle image fluctuations decrease. The values for this vary from high mD value (liquid) to a lower plateau value (solid and no evolution of the structure), as presented in figure 1 above. What were the results? Figure 3 below shows the microscopic dynamics (mD) versus time for different sample thicknesses (100 and 250μm) and different temperatures (50 ℃ and 100°C).  From the sudden decrease of the mobility (mD), the characteristic ‘open time’ can be determined. The ‘open time’ is influenced by the wet film thickness and temperature. At the same temperature (50 °C for example), the open time Tc of the thinner sample (100μm, green) is shorter than the Tc of the sample 250μm thick (blue). The same influence is valid at 100 °C. This result shows that the instrument allows to monitor the battery’s slurries microscopic dynamics (mD) at different drying conditions providing a characteristic time, Tc, which could be tuned by the formulation or other process parameters (Sample Thickness, Temperature, Humidity, etc.) to fit the best with the fabrication process needs. Another interesting information is the exact determination of the drying time, the time when the mobility (mD) of the sample reaches a steady state (a plateau). To do so, we will focus on the time when the mD reached a plateau at 10-3 (Hz) (as shown in Figure 4). 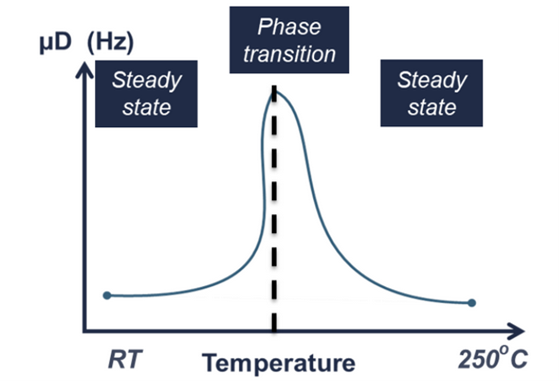 When the mD level reaches a plateau at 10-3 (Hz) the sample dynamics contribution is almost negligible, indicating that the sample is completely dry. So, it allows the measurement of the drying time Td. Figure 4 shows that the drying time is influenced by the thickness and temperature. At the same temperature (100°C for example), the drying time (Td) of the thicker sample (250 μm, yellow) is longer than the Td of the sample 100 μm thick (red). The same influence is valid at 50 °C. To facilitate the ranking of different formulations or other process parameters influence on the drying (Thickness, Temperature, Humidity...), the software allows the measurement of the microscopic dynamics evolution, mDE (Figure 5). 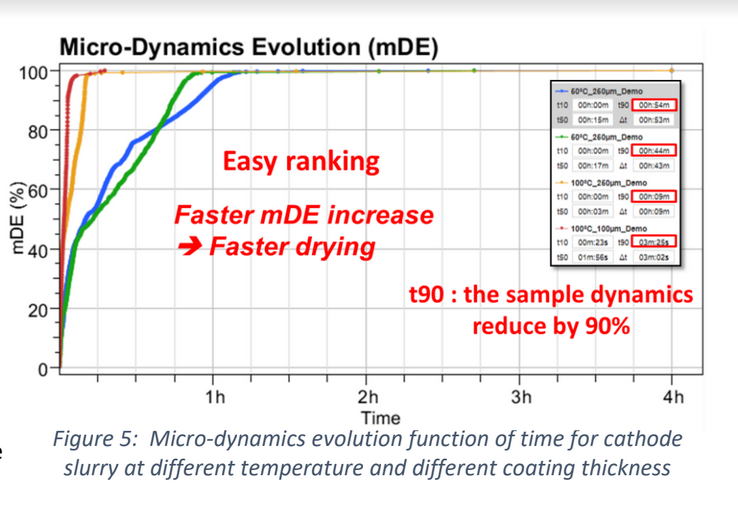 The curves (Figure 5) correspond to the areas under each mD curve (Figure 4) at a selected time window. The mDE is directly correlated to the drying speed. The faster the mDE reaches 100%, the faster the drying.
This result provides more statistics that allow us to rank the mobility of different formulations or other process parameters and their influence on drying time. Figure 5 shows a ranking in agreement with the drying times determined for the different samples (Figure 4). The software also allows us to determine another characteristic time, ‘t90’, where the slurry’s microscopic mobility decreases by 90% (inset figure5). For this slurry, the ‘t90’ is very close to the ‘open time’ identified in Figure 3 (‘t90’ ≈ ‘Tc’) due to the significant decrease of the mobility (Figure 3). Conclusion The Rheolaser Coating high temperature presents an in-situ, non-invasive and useful method to better understand your different materials, which allows: • The monitoring and precise knowledge of the curing and drying kinetics • The determination of the characteristic times of the film forming process • The evaluation of the formulation parameters impact on the film formation • The optimization of the manufacturing protocol according to different substrate materials. |
C HumphreysOctober 2016 Fullbrook Systems Ltd move to new premises in Hemel Hempstead. After being in the same offices for many years the company moved to more suitable premises Archives
February 2023
Categories |
 RSS Feed