 In the dairy industry, milk is often dehydrated, with milk powder holding a longer shelf life than liquid milk, since it does not require refrigeration. As a result, it is easier to transport. However, dehydration must not alter the milk properties; consequently, it is important to check if the rehydrated milk has the same properties as the native milk. Another aspect is to measure the rehydration kinetics to optimize the rehydration process. In this blog post, we look at a method for assessing the kinetics and the efficiency of the rehydration of milk powder. We also analyse the stability of rehydrated milk powder. How was this study carried out? To achieve this goal, milk protein concentrate was rehydrated for 6 hours. During rehydration, a sample was taken every 10 minutes and the backscattering level was analysed with a Turbiscan LAB. The results were then compared to the backscattering level of the sample before dehydration. Rehydration is completed as soon as the backscattering level of the native and the rehydrated milk are equivalent. What were the results of the rehydration kinetics? Figure 2 below shows the evolution of backscattering level with time for the rehydrated milk. The results were compared to the backscattering level of the native milk. 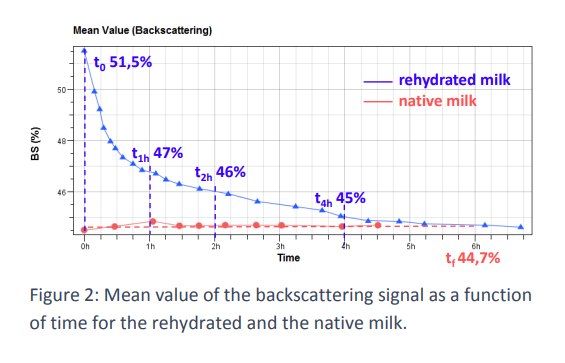 The graph shows that immediately after rehydration, the rehydrated milk has a much higher backscattering level than the native one (51.1 % vs 44.7 %). The backscattering level of the rehydrated milk then decreases until it reaches the level of the native milk, i.e. the same concentration and the same particle size. The rehydration is seen to be complete after 4 hours of mixing. It is interesting to note from this experiment that the rehydration process is not linear. Indeed, at the beginning of the rehydration, the backscattering level decreases quickly. After 1 hour of mixing, the signal is already reduced to 47%, meaning that 2/3 of the rehydration process has completed within an hour. The stability of rehydrated powder After rehydration, the stability of milk powder at 2 different concentrations (10 % and 20 %) was assessed for 1 day at 25°C. With the help of the Turbiscan profiles, we can identify the destabilization phenomena occurring in the samples: for both milk powders, a creaming phenomenon is occurring at the top of the sample and a clarification at the bottom. To assess global stability, all the destabilisations occurring in the sample must be considered. The Turbiscan Stability Index (TSI) was created for this exact purpose, which sums all the variations over the entire sample. As a result, if the signal varies a lot, the TSI will be high. Therefore, the higher the TSI, the lower the stability. Figure 5 shows the evolution of TSI as a function of time the graph clearly shows that the sample at 20% concentration is more stable than the 10% one. 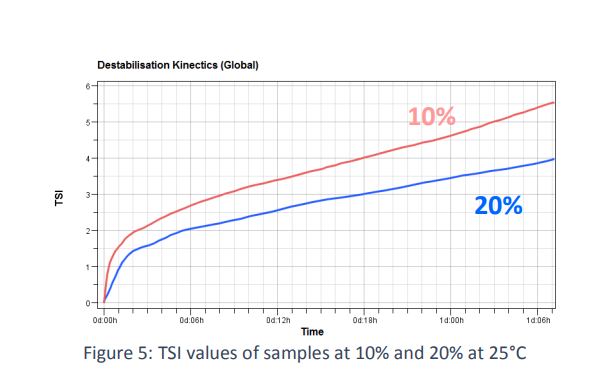 The following table displays TSI values after 30 minutes and 1 day of measurement, showing that samples can be differentiated after only 30 minutes of measurement.
Conclusion A simple method based on comparison of signals obtained with milk before and after rehydration is proposed to control the rehydration of milk powder using the Turbiscan LAB. Turbiscan LAB also allows us to compare samples in terms of stability in one click using the TSI tool; in the present study, samples can be ranked in only 30 minutes. For more information about the Turbiscan and how it can help you with your own research in the dairy industry, please contact us on 01442 876777 or email: sales@fullbrook.com.
0 Comments
|
C HumphreysOctober 2016 Fullbrook Systems Ltd move to new premises in Hemel Hempstead. After being in the same offices for many years the company moved to more suitable premises Archives
February 2023
Categories |
 RSS Feed