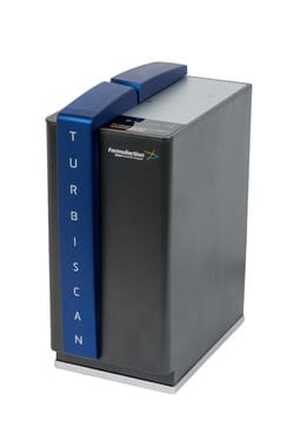
Using Turbiscan Technology to optimise particle suspension stability by the Hansen approach25/11/2021 It is crucial across both academia and industry that the properties and lifetimes of products are enhanced by formulating stable particle suspensions. These industries include personal care, pharmaceuticals, agriculture, and energy. The stabilisation medium is a key factor in avoiding particle agglomeration before expensive additives, such as surfactants and polymers, are added. The Hansen Parameters method has been developed to predict this stabilisation medium, and the aim of this study is to demonstrate that accurate determination of the HP of particles (Titanium Dioxide (TiO2)) can be obtained using Turbiscan Technology. By knowing the HP of particles, it becomes easier to predict greener and cheaper solvents to optimise particle formulation in terms of the content of costly stabilising additives. How does the Turbiscan technology work? Turbiscan technology is based on Static Multiple Light Scattering (SMLS), which involves sending a light source on to a sample in its native state to acquire a backscattered and transmitted signal. By repeating this measurement over time, at a user defined frequency, the Turbiscan monitors the physical stability of a sample without dilution. To compare the stability of different suspensions in a quantitative way, the Turbiscan Stability Index (TSI) can be used. The TSI is a number calculated at a time (t) by summing up all temporal and spatial variations within a considered zone. The higher the TSI value – the more unstable the product. The main advantage of using the Turbiscan technology in the Hansen approach is to discriminate in an accurate way, the tiny stability variations of solvents tested as good dispersion media; which is difficult by conventional observation. Such measurements allow the generation of a Hansen sphere, which is more precise and restrictive than the ones obtained through visual characterization of samples. How was suspension stability evaluated? The TiO2 particles were dispersed using the ultrasonic probe “Sonotrode” in 18 different solvents. Following the dispersion step, the sample was immediately samples, and its stability was measured for 30 minutes at 25 °C in a Turbiscan Tower. To “score” the different solvents, the TSI scale was used in a quantitative manner to measure the stability evolution of suspensions. Each solvent was scored from 4 when a completely unstable suspension is obtained (TSI>10), to 1 for a suspension with a high stability (TSI < 0.5) How were the selected solvents rated as a good or poor stabilisation media? Having measured the TSI values, each solvent can be scored with respect to its ability to stabilize TiO2 particles and, therefore, build the corresponding Hansen sphere. From these values obtained for the TiO2 particles and the HP of other solvents available in literature, it is easy to calculate the Relative Energy Difference (RED) and predict if the selected solvents will be a good or a poor stabilisation media. A classification of the solvent stabilization properties can be also predicted considering that the lower the RED value, the more stabilized the suspension that will be obtained. It is possible to design a mixture of solvents that highlight an even better stability, which will be much closer to the sphere centre. Summary This study with the Turbiscan technology was carried out to quantify and compare the effect of stabilisation media on the stability of different Titanium Dioxide particle suspensions. Through calculation of the TSI, different solvents were tested and classified, making this method suitable for the HP approach for predicting new stabilisation media. This method shows a direct application in predicting better stabilisation media, as well as greener and cheaper solvents to optimise particle formulation in terms of expensive stabilising additives. Since the Turbiscan technology can discriminate the stability and the dispersibility of particles, the HP approach could be also employed to characterize the dispersibility properties of solvents. To find out more about how the Turbiscan Technology can help your work, please call us on: 01442 876777 or email: sales@fullbrook.com. We can offer you a free, no obligation quote, as well as the opportunity to test some samples. 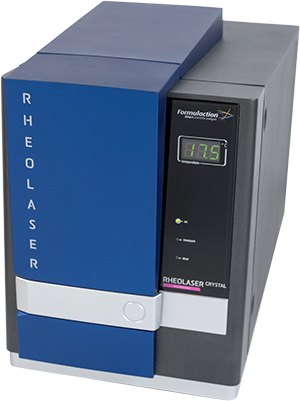
0 Comments
For those working in the dairy industry, Formulaction’s Rheolaser CRYSTAL can help optimise butter production by measuring the melting profiles of fresh cream samples. Fresh cream is the fatty part of milk and is made up of different triglycerides with a wide range of melting points, due to a mixture long and short chains, which can be either saturated or unsaturated. Seasonal changes in feeding directly impact this composition. When cattle are held on fresh pasture the triglycerides tend to be unsaturated, whereas when they are kept in during the winter this produces saturated triglycerides. This variability directly impacts the type of butter that can be made at certain times of the year. A higher ratio of unsaturated triglycerides leads to a reduction in the melting point of the produced butter, and this may affect its suitability for certain applications. How does the Rheolaser Crystal Work? The Rheolaser CRYSTAL operates using Diffusing Wave Spectroscopy (DWS), a multiple light scattering technique. Briefly, the motion of the microstructure is measured as function of temperature. During heating and cooling, characteristic peaks can be acquired for phase transitions, such as melting, crystallization, and polymorphic transitions. How can the Rheolaser CRYSTAL aid butter production? Let’s take, for example, a specific butter created for puff pastry. Puff pastry is made by folding the pastry several times and introducing a high melting point butter. This butter is called “Beurre AOP de tourage”, which is usually made from cream with a high ratio of saturated triglycerides during the winter months. Three batches of March cream (early, middle, and late) were studied immediately after pasteurisation. An aliquot of cream was introduced into the closed cell (~2mL) of the Rheolaser CRYSTAL and a temperature ramp of 2 °C / min was applied from 8 °C to 50 °C. A characteristic peak at 34°C can be observed for the early March cream, whereas the middle and later creams have lower transitions. This shift to lower temperatures is due to the presence of more unsaturated triglycerides, due to the cattle being put out to pasture at the beginning of the spring. The weekly monitoring of fresh pasteurized cream suggests that after the middle of March, the cream is no longer suitable for puff pastry butter. In autumn, the reappearance of the peak will indicate the possibility of making the Beurre AOP de tourage butter again. Therefore, this study shows us that the Rheolaser CRYSTAL can aid with routine measurements and determine the seasonal changes in cream. By observing the mean melting temperature of fresh cream with the Rheolaser’s highly sensitive method, an exact indication on whether to produce individual butters can be provided.
Turbiscan Applications: Optimising Vaccine Efficiency Through Separation and Flocculation Testing9/11/2021 At Fullbrook Systems, one of our most popular product ranges is the Turbiscan by Formulaction. Over the years, these instruments have been cited in hundreds of journals and peer-reviewed articles across biology, chemistry, pharmaceuticals, and engineering. This week, we focus on how the Turbiscan can help optimise vaccine efficiency via separation and flocculation testing. What are the benefits of using the Turbiscan for this purpose? Firstly, the Turbiscan provides fast and reliable migration rates. This means you can rapidly quantify particle migration rates to characterise vaccine stability and dose uniformity. You can also study the ability of the drug to redisperse under storage time or temperature conditions, and work on the sample without the need of dilution. This allows the testing of prefilled syringes or vials. All types of vaccines can be worked on with the Turbiscan, including deactivated, attenuated virus, m-RNA and toxoids. How will the Turbiscan help me with the development process? To shorten the development process, scientists need reliable characterization methods to rapidly optimize formulations with inactivated-attenuated viruses or next generation vaccines (DNA, mRNA, etc.). Vaccine efficiency depends highly on the dispersion state of the product at the moment of administration, which is why vaccines often need to be reconstituted before they can be used. Physical characterization of vaccines can be achieved by measuring the migration and flocculation rates and thus evaluate the dispersion state over time. Analysis with the Turbiscan is reliable and highly precise, enabling the optimization of the vaccine formulation. This optimisation gives enhanced dose uniformity, optimised efficiency and easy reconstitution. How does the Turbiscan technology work? The Turbiscan uses Static Multiple Light Scattering (SMLS) to detect particle migration and size variation in liquid dispersions. The Transmission (T) and Backscattering (BS) signals measured are related to particle size, and concentration, and their variation over time is a sign of destabilization. The Turbiscan® range has been used worldwide for over 25 years, to detect at an early stage all kinds of destabilizations such as coalescence, flocculation, creaming, and sedimentation. As mentioned earlier, any samples including emulsions, suspensions, dispersions, or foams can be studied at full concentration range (up to 95 %v/v) without dilution or sample preparation. Are there any other features of the Turbiscan that can help me with my vaccine development? Scientists need to consider biological, chemical, and physical challenges at each step of the process, as well as all related conditions, to maintain the product’s long shelf life. As well as the benefits outlined above, the Turbiscan can also help with: • Faster vaccine characterisation – a 24-hour visual observation can be undertaken in 30 minutes due to highly sensitive detection systems. • Boost vaccine immunogenicity through adjuvant selection and formulation adjustment. • Quickly screen a large panel of vaccine carrier molecules • Easily reconstitute and resuspend formulations for perfect dosing. • User friendly equipment - quick and easy to deploy and operate. • Create products with a long shelf life by studying your formulations under real storage conditions. How do I find out more about the Turbiscan and its vaccine stability applications? Please call us on 01442 876777 or email sales@fullbrook.com for a no obligation quote, or to discuss your requirements further.  If your research and production require accurate measurement of light scattering components, both in-line and in real time, then the Kemtrak Inline Turbidity Meter offers an ideal solution. This easy-to-use industrial process fibre optic turbidimeter contains long-life solid state LED lamps and precision fibre optics to provide drift and noise-free measurement at extremely high precision. Hassle free operation is ensured by automatic compensation of sample colour and fouling of the optical windows. The scratch resistant sapphire windows have no electronics or moving parts, making the unit appropriate for use in hazardous areas, as well as making them maintenance free. Other benefits of this popular piece of kit from Kemtrak include: • ISO 7027:1999(E) compliant • Reliable and robust infrared LED lamp • Extensive range of robust fibre optic measurement cells • Analogue output (0/4-20 mA) • Local and web based graphical user interface (TCP/IP). How does the Kemtrak Turbidity Meter work? The turbidity meter is made up of a control unit, flow cell and fibre optics, and is designed to measure the lack of clarity or “cloudiness” of a fluid caused by undissolved particles. Modern turbidimeters use a technique called nephelometry, which measures the amount of light scattered at right angles to an incident light beam. Both transmitted light and scattered light at 90° is measured and mathematically combined using a ratio algorithm to calculate the turbidity of the sample. The dual detection system and ratio algorithm then provides a turbidity measurement that has significantly better performance with coloured and/or light absorbing samples. A long-life LED light source is used to produce reliable turbidity measurements from 0.01 to over 4 000 NTU depending upon the configuration of the optical measurement cell or probe. This means the Kemtrak TC007 is an instrument of high accuracy with long-term calibration stability. What applications is the Kemtrak Turbidity Meter normally used for? The Kemtrak is typically applied in: • Filtration monitoring • Centrifuge control • Interface detection • Phase separation • Leak detection • Oil in water • Quality control To find out more about how this technology can benefit your research, production, or development, get in touch by calling: 01442 876777, or email us at: sales@fullbrook.com. 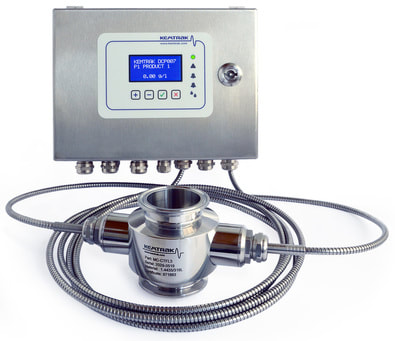 |
C HumphreysOctober 2016 Fullbrook Systems Ltd move to new premises in Hemel Hempstead. After being in the same offices for many years the company moved to more suitable premises Archives
February 2023
Categories |
 RSS Feed