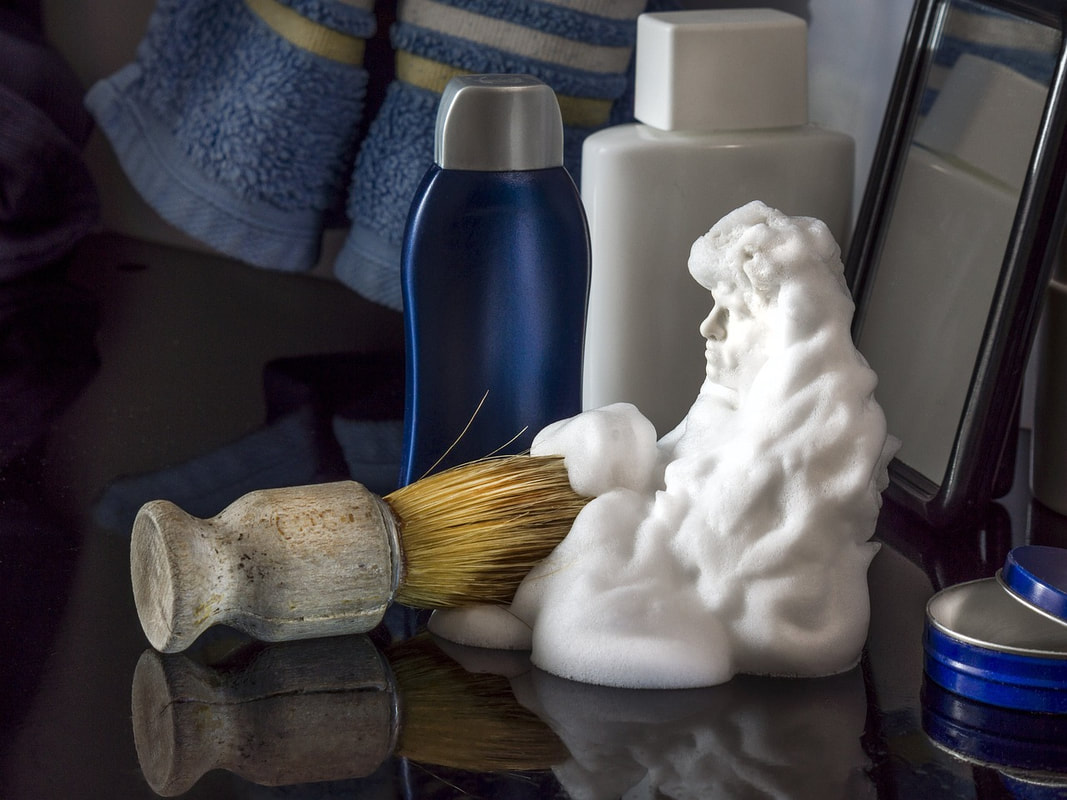
 What is a foam? A foam is formed by entraining gas in a liquid. The stability of a foam needs to be matched to its purpose, a shaving foam may only last for a few minutes, a foam filler may need to last hours or even days. With shaving foams, the foam must remain stable when applied to skin at body temperature (37°C). This means that the kinetics of the foam breaking is a fundamental parameter for the formulator. However, this characterization is very difficult to perform due to the inherent fragility of the foam. Using the Turbiscan technology and its ability to scan the sample over time, it is now possible to study and characterize all types of foam. In this week’s blog post, we look at how two different shaving foams have been characterized to compare the stability of different formulations. How does the Turbiscan work? As mentioned in our previous blog posts, the Turbiscan technology is based on Static Multiple Light Scattering, which consists of sending 880 nm near infrared light into a sample and acquiring backscattered (BS) and transmitted (T) light whilst scanning over the entire sample height. By repeating this measurement over time, the instrument enables us to measure physical stability. The signal is directly linked to the particle concentration (φ) and size (d) according to the Mie theory: 𝑩𝑺 = 𝒇(φ, 𝒅) How was the study carried out? Commercial shaving foams were analysed using the Turbiscan technology by scanning each sample at a frequency of one scan every 30 seconds for 3 hours (361 scans). All the measurements were performed at 37°C to simulate body temperature to evaluate the foam stability under real conditions. Due to the fragile structure of the foams, they were generated inside the measurement cells to avoid any sampling. What were the results? From the raw data in the graph below (figure 1), we can see a global decrease of the intensity of backscattering over the time of analysis, which is caused by a size increase of the air bubbles over time. The air bubbles coalesce together to form bigger ones. 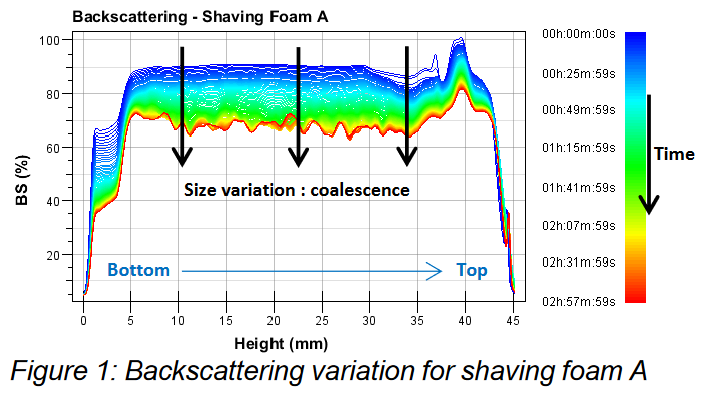 To enable the characterisation of the different shaving foams, the following parameters are calculated: • The global stability • The kinetics of bubble coalescence. In terms of global stability, it is possible to monitor the destabilization kinetics in the samples versus ageing time, due to the Turbiscan Stability Index (TSI). This sums all the variations detected in the sample (coalescence, clarification, liquid drainage, etc). At a given ageing time, the higher the TSI, the more unstable the sample. From Figure 2 & Table 1 below, we can discern that there is a less of a change in shaving foam B (coalescence of the bubbles) and therefore this sample can be considered to be more stable. 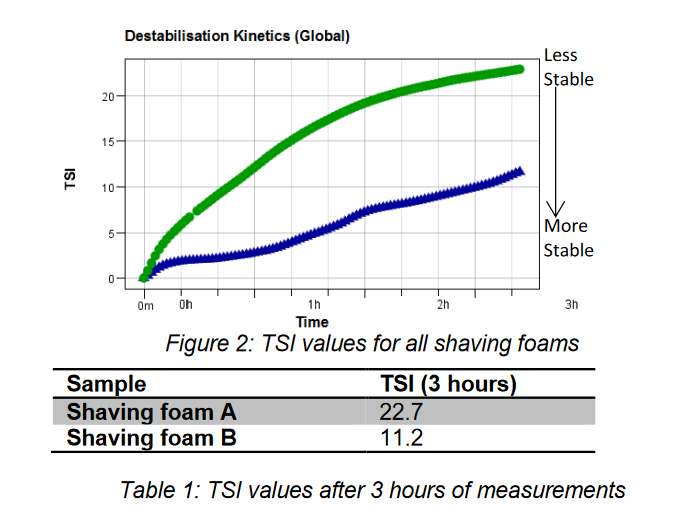 Looking at the kinetics of bubble coalescence, we can see that over time, the air bubbles tend to coalesce so that their size increases until they reach a maximum then the bubbles burst and liquid is released. The Turbiscan software allows the automatic computation of the mean diameter of the air bubbles directly from the level of backscattering of the foam phase. The graph in Figure 4 below has been generated using the following parameters: 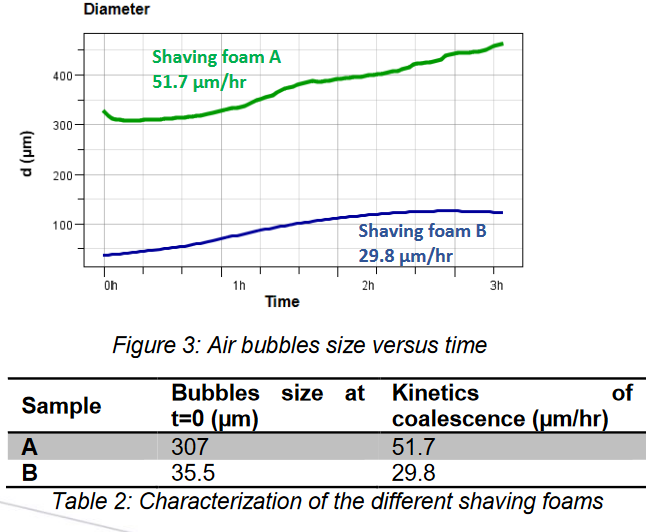 According to Figure 3 and table 2 we can conclude the following:
• The air bubbles in foam A are 10x larger than Foam B at the start of the experiment. • The air bubbles on the foam B coalesce at a slower rate than foam A. The optical microscopy requires many analyses to obtain accurate data. When the foam is placed between the slide and the cover glass the bubbles can interact and break differently from when they are left to change “naturally”. We have assumed that the bigger bubbles are broken whilst sampling the foam. Nevertheless, this technique is commonly used in industry and provides information on the bubbles shape and can be used to determine the bubbles mean diameter (it is necessary to take many samples for the results to be statistically valid). The shaving foams in this study were also analysed using microscopic techniques, the mean bubble size was determined after 10 experiments and was equal to about 20 μm (shaving foam B). This value can be compared to the value obtained with the Turbiscan (about 35 μm), it should be remembered that the larger bubbles are not broken during the testing with the Turbiscan, as there is no need to sample the product. Another significant advantage of the Turbiscan is that the size evolution of the bubbles is continuously measured during the foam coalescence. Conclusion In this study, 2 different shaving foams have been analysed and completely characterized using the Turbiscan technology in a very short time. Using the Turbisoft software it is possible to measure the following parameters: • Turbiscan Stability Index (Global Measurement of Stability) • Average Bubble Size at start of experiment • Change in average Bubble Size over experiment. It can be seen that all of the parameters show that foam B has better stability properties that all stem from the original smaller bubble size at the start of the experiment. The graph below summarises all the computation done during this study. If you’d like to know more about the Turbiscan technology, and how it can help with your own research, development and processes, please call us on: 01442 876777, or email: sales@fullbrook.com.
1 Comment
|
C HumphreysOctober 2016 Fullbrook Systems Ltd move to new premises in Hemel Hempstead. After being in the same offices for many years the company moved to more suitable premises Archives
February 2023
Categories |
 RSS Feed