|
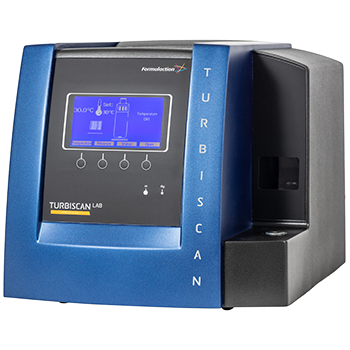
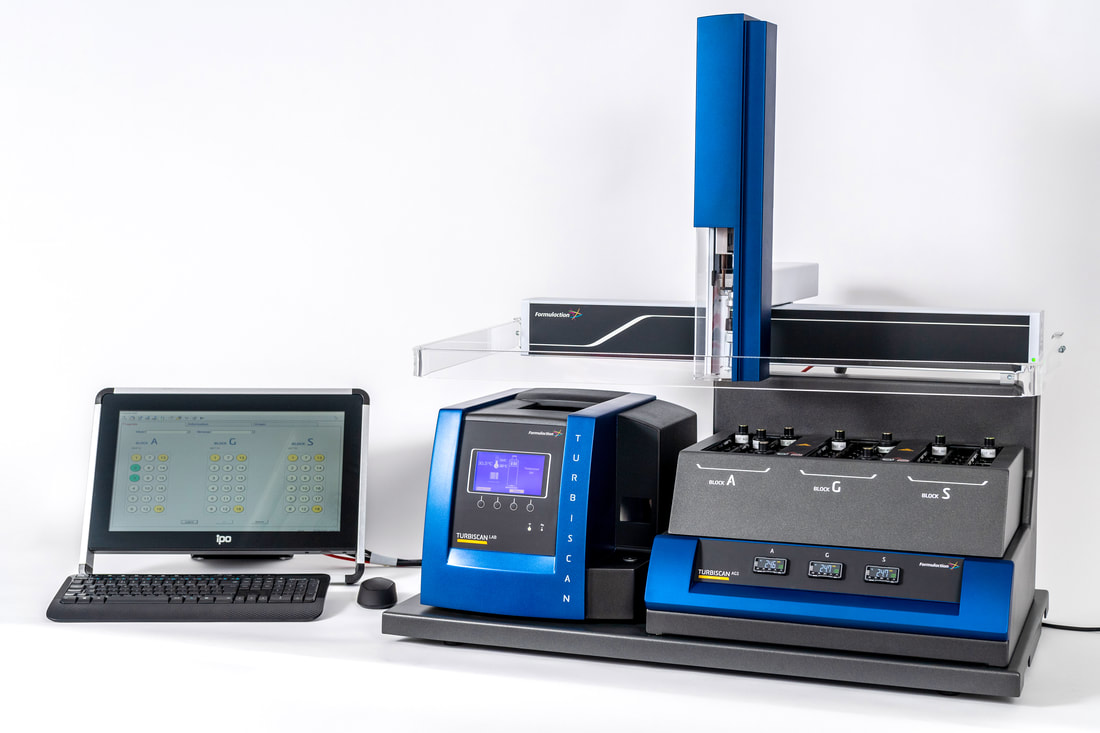
In this post, we discuss how the Turbiscan Stability Index (TSI) from Formulaction can help you establish surfactant efficiency and emulsion stability. The objective of this study was to analyse the influence of various parameters on the stability of emulsions including surfactant choice, temperature and concentration, using the Turbiscan AGS and Tower as well as the TSI. What are emulsions? Emulsions are defined as unstable colloidal systems that may experience many destabilisation phenomena, such as flocculation, creaming, and coalescence, that can be caused by a variety of reasons, including lack of surfactant to stabilise the interfaces, and attractive forces, etc. This means that if you are formulating an emulsion, it is important to know the origins of these processes and how to overcome them, to achieve a stable final product. Due to the presence of small and big droplets, as well as chemical interactions - droplets tend to flocculate, although the addition of surfactants may minimise this problem. This study investigated how different surfactants influenced the flocculation of the droplets, as well as the effect of surfactant concentration and the storage temperature. What was the measurement protocol? An O/W emulsion was formulated using oil (triglyceride) , 1% xanthan, and one of two additional non-ionic surfactants with different lipophilic chains. These were Tween 80 (HLB 150 and Tween 65 (HLB 10.5). A reference emulsion was also studied, with no additional surfactant present. How were the destabilisation phenomena detected? Using the Turbiscan technology, destabilisation phenomena were detected in these formulations, showing evidence of pure coalescence in the samples without any droplet migration. How were the phenomena quantified? The TSI can monitor the coalescence kinetics in the samples versus ageing time. It does this by adding up all the variations detected in the sample (size and/or concentration). At any given ageing time, it was found that the higher the TSI, the more inferior the stability of the sample. The effect of both surfactants can be compared to the reference, which showed that Tween 65 has no influence on the stabilisation of the coalescence in this sample, as its HLB is not high enough to play a stabilising role. This is compared to Tween 80, which significantly decreases the kinetics of coalescence. This means that to increase the stability of the emulsion, surfactant Tween 80 must be added to this formulation. However, it’s important to remember that the surfactant is an expensive part of the final product, and the global stability is not proportional to the amount of surfactant. As a next step, we then need to identify the optimal amount of surfactant to achieve the best stability for the lowest price. How was this determined? An analysis was made with a 0%, 0.5%, 1% and 2% of surfactant, and the TSI was computed for each formulation after 1 day of ageing. The results showed that the optimum amount of surfactant for this particular formulation is 1%. The TSI was similar for the 2% of surfactant, which shows that increasing the upper limit beyond 1% is unhelpful for stability and increases the cost for no reason. Summary The Turbiscan allows the qualification of the best surfactant for a given emulsion to minimize the coalescence rate. This is possible in all types of concentrated dispersions without dilution, by comparing different formulations and optimising the best one. The Turbiscan also provides a unique tool for monitoring the kinetics of system destabilisation, and quantifying it accurately after identifying the phenomena.
0 Comments
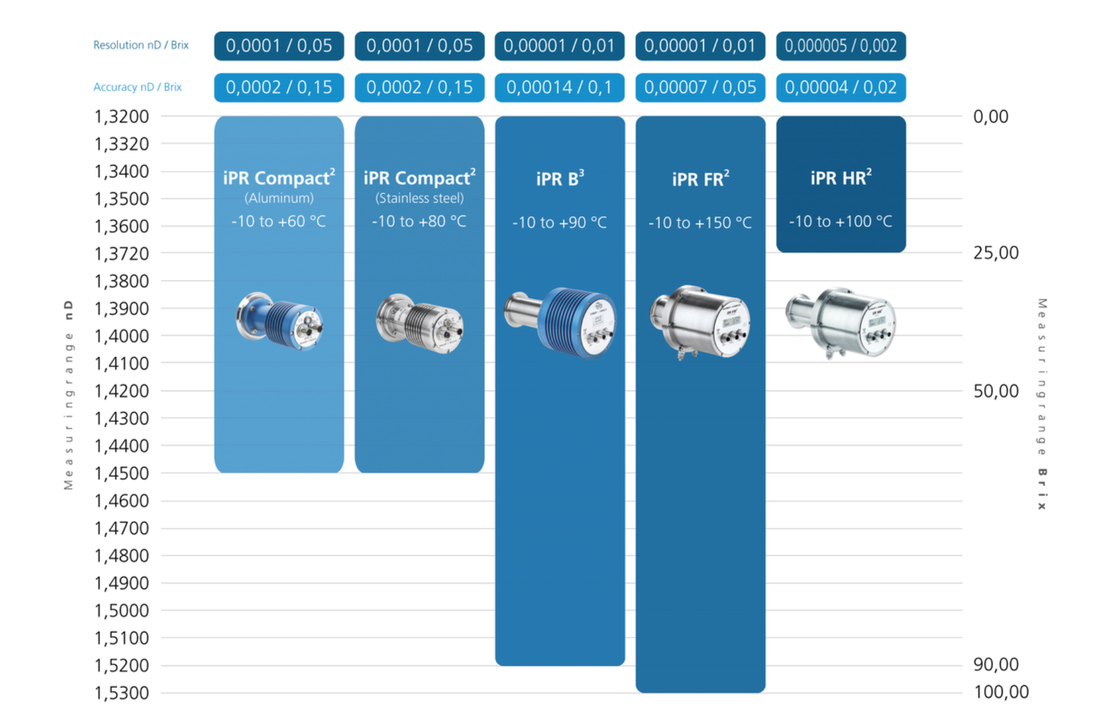
Inline process refractometers and sensors can perform industrial measurements continuously, and in real time. This technology is also known as PAT (Process Analytical Technology), and here at Fullbrook Systems, we provide Schmidt & Haensch’s leading range of inline refractometers that allow you to monitor and control your processes without product loss or process divergence. With Schmidt & Haensch’s process refractometers, quality control and the determination of liquid concentration and mixing ratios becomes simple. Measurements are always reliable and independent of turbidity, colour, absorption, and viscosity. This ensures the highest precision and improved process control. How does Process Analytical Technology work? Process Analytical Technology (PAT) is a manufacturing methodology for high value chemicals and pharmaceuticals. Critical Process Parameters (CPPs) and Key Performance Indicators (KPIs) of the process are comprehended, well-defined and continually monitored to ensure that the pre-defined Critical Quality Attributes (CQA) of the final product are consistently achieved. PAT measures key quality and performance indicators in both raw and in-process materials in real-time. A well-designed PAT-based process is stable, ensuring that the critical parameters and indicators remain within pre-described limits to safeguard product quality and process safety. What instruments does the range include and what are their benefits? The current range of Schmidt & Haensch inline refractometers include:
 Which industries can these refractometers be applied to?
The refractometers from Schmidt & Haensch can be used in the following industries:
To find out more about how our inline refractometers can help you, please call us on: 01442 876777 or email us at: sales@fullbrook.com where we will also be happy to provide you with a free, no obligation quote. Quantifying The Redispersion Potential Of Aluminium Salts In Vaccines Using Turbiscan Technology11/1/2022 Adjuvants such as Aluminium Salt (Alum) are often added to vaccines to enhance their immune responses. These adjuvants can aggregate and settle over time due to their electrical charges. This can result in a compact sediment that can be difficult to redisperse depending on the strength of the bonds between the particles. If this occurs within the shelf life, the following problems present themselves: • Knowing whether the injected dose remains the same, i.e., do all active ingredients pass through the needle of the syringe despite the large, compacted aggregates? • Or is it the case that the therapeutic efficacy and the immunogenicity are reduced (i.e., the masked antigen in the aggregate does not get injected). How does the Turbiscan technology in this study work? Based on Static Multiple Light Scattering, the Turbiscan technology works by sending a light source into a sample and acquiring the backscattered and transmitted signal all over its height. By repeating this measurement over time at adapted frequency, the instrument enables us to monitor physical stability. The signal is then linked directly to the particle concentration and size according to the Mie theory, knowing the refractive index of continuous and dispersed phase. What methods were used in this study? To prevent the loss of immunogenicity, the solution is subjected to a controlled flocculation (by variation of the pH or ionic strength). This results in weakly-bonded particles that form a loose flocculation and produce a low-density sediment (containing a large amount of water) that is then easy to redisperse. Conventional method: Sedimentation Volume Ratio (SVR) The conventional method to determine the flocculation tendency of vaccines is to measure the height of the sediment (SVR) on completion of suspension settling after 24 hours. The SVR is the ratio of the settled sediment height to that of the initial suspension. A higher SVR value should translate to better suspendibility as the sediment is less compact. This ratio can be measured with the Turbiscan from via the evolution of the backscattering signal. New method: Settling Onset Time Although the conventional SVR method is reliable, it is unfortunately still too long for quality control or routine testing. The new Settling Onset Time method is more convenient due to its quick response time (less than 30 minutes). The Settling Onset Time corresponds to the time to reach 50% of the clarification of the suspension (50% of maximum light transmitted through the sample). Settling Onset Time is then determined from the transmission signal by determining the time for which clarification area at 50% of transmission gets higher than a few millimetres. To validate the new Settling Onset Time as a new screening method, the relationship between SVR at 24 hours and the Settling Onset Time was determined with suspensions of AIPO4, at a different pH (3 to 9), ionic strength (0 to 1000 mM NaCl) and either with or without the model antigen (BSA or lysozyme). How were measurements carried out? Turbiscan measurements were made using 20mL of suspension in a flat-bottom cylindrical glass vial, and each data set was collected over a period of 24 hours. The Settling Onset Time after 30 minutes and the sedimentation volume ratio (SVR) after 24 hours for each sample were obtained from the transmission and the backscattering data, respectively. What were the results of the study? The results showed a 2-slope curve depending on whether the system is flocculated or deflocculated. 1. When the suspension is deflocculated, (e.g., low pH and without NaCl) the AIPO4 particles remain as discrete units resulting in a slow sedimentation rate. This then prevents the entrapment of solvent within the sediment. Here, it tends to compact to a hard cake and is difficult to redisperse. This is reflected by a low SVR value. 2. In a flocculated suspension (e.g., medium to high pH and/or high ionic strength), the loose structure of the floccs is difficult to preserve in the sediment that contains a large amount of entrapped water. The volume of final sediment is relatively large, reflected by a larger SVR. The sediment rate is high and is strongly dependent on the flocculation level. Controlling these properties guarantees a good redispersion of the sediment and by extension its immunogenicity. The lower the Settling Onset Time, the more powerful the therapeutic efficiency. Conclusion The Turbiscan can help researchers design a correctly flocculated Alum-containing formulation. By varying the pH, ionic strength, and the quantity of antigens, it is possible to identify the ideal conditions that favour a flocculated system. The use of the settling characterisation methodology outlined above supports this decision. The Settling Onset Time and SVR data from the Turbiscan analysis identified the transition zone between the flocculated and deflocculated states of AIPO4 formulations. Finally, since the analytical time is much shorter, the Settling Onset Time values can replace the SVR data, as it is more adapted to formulation screening activities.  Those working in the inks industry will know that inkjet formulations contain pigment particles that destabilise over their shelf life. This can lead to instability in forms of particle sedimentation and packing, causing poor product performance and the clogging of inkjet ports, resulting in instrument shutdown while the printer head is cleaned. Although this issue can be rectified with mixing by jet head movement or manually shaking the ink to redistribute the sample to its original state, predicting the instability in the first place helps to avoid such problems in the future. In this post, we look at how Turbiscan technology by Formulaction is used to quantify and predict this instability related to various inkjet formulations. How does the Turbiscan technology work? The Turbiscan technology is based on Static Multiple Light Scattering (SMLS) which involves sending a light source on to a sample and acquiring both backscattered (BS) and transmitted (T) lights over the entire sample height. Repeating this measurement over time with an adapted frequency allows the instrument to monitor physical stability. The signal is directly linked to particle concentration and size via the Mie theory. How was the study carried out? Two inkjet samples, one with red pigment and the other yellow, were analysed to observe the differences achieved by using different pigments. Each sample was scanned at 30-minute intervals for 3 days to produce full destabilisation profiles. Effects relating to sedimentation, packing, and overall phase separation could then be determined. The samples in this study all displayed similar behaviour, and the unique features of the Turbisoft programme allowed for further quantification of the kinetics responsible for destabilisation. Monitoring the average value of backscattered light at the bottom of the sample (where packing occurs), allows the determination of the packing kinetic for each dispersion. These calculations provide the formulator with the additional knowledge for optimising the formulations to achieve the desired properties. It was found that the yellow pigment has a uniform-packing kinetic, whereas the red pigment has slightly more variation. This is because the red starts more slowly but overtakes the yellow after 14 hours due to it having a more intense kinetic. The destabilisation was then quantified using the Turbiscan Stability Index. This is an algorithm-based calculation in the Turbisoft software that compares all of the destabilisations, and produces a single number for easy, one-click ranking and comparison. What were the results? The raw data produced from this study shows all of the destabilisation phenomena. The top of the sample shows that there is a large negative signal in the backscattering region, which indicates that particles are moving away from this region as the sample begins to clarify. Normally, a sedimentation, would produce a positive peak at the bottom of the sample – due to the increase in volume fraction, within this zone. However, this data shows a decrease within this region. This is caused by an increase in the “average” particle size within the sediment layer = Packing within the sediment layer. The TSI graph plot shows that the red pigment sample destabilises faster than the yellow pigment. This follows the previously seen trend that packing is the predominant instability, and the evaluation of the TSI at only 2 hours allows us to predict further stability differences between the two formulations. The ability of the TSI to quantify the stability of the dispersions in just a matter of hours is a key benefit for the formulating scientist. Summary The study shows that two inkjet formulations provided a similar destabilisation phenomenon, but by only using visual observation it is difficult to show which one is the most stable. It further highlights that the Turbiscan technology can provide the following benefits:
To find out more about how Turbiscan technology can help you with your inkjet formulations, please call us on 01442 876777 or email: sales@fullbrook.com.
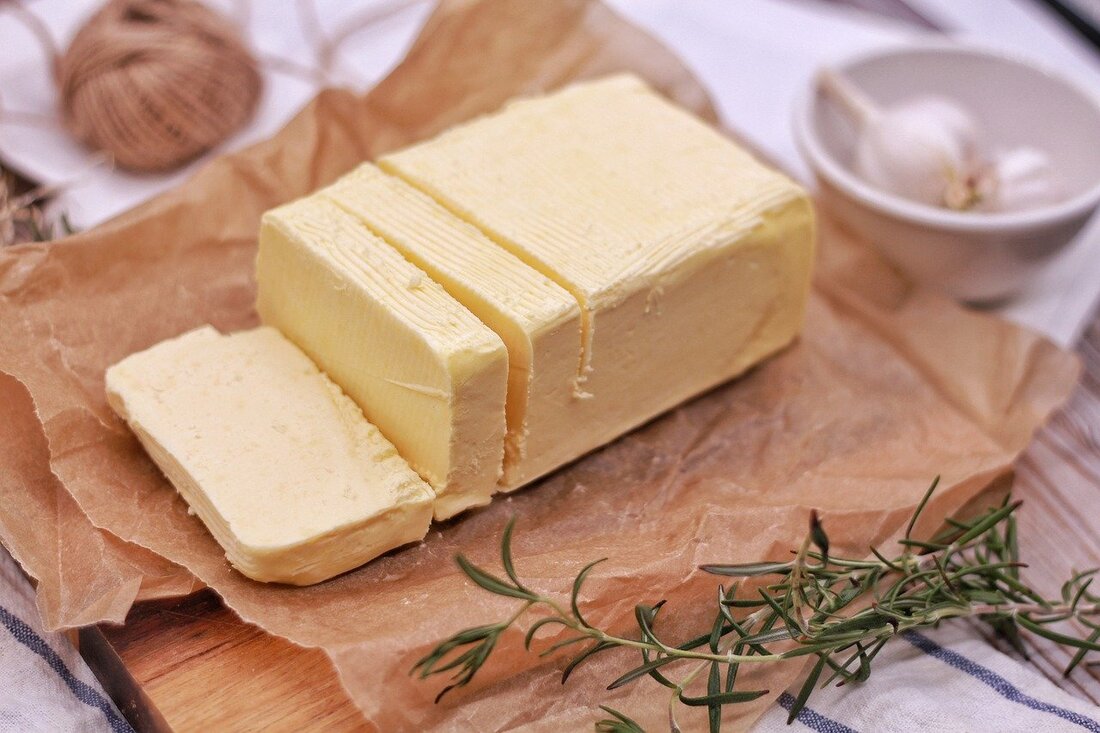
Using Turbiscan Technology to optimise particle suspension stability by the Hansen approach25/11/2021 It is crucial across both academia and industry that the properties and lifetimes of products are enhanced by formulating stable particle suspensions. These industries include personal care, pharmaceuticals, agriculture, and energy. The stabilisation medium is a key factor in avoiding particle agglomeration before expensive additives, such as surfactants and polymers, are added. The Hansen Parameters method has been developed to predict this stabilisation medium, and the aim of this study is to demonstrate that accurate determination of the HP of particles (Titanium Dioxide (TiO2)) can be obtained using Turbiscan Technology. By knowing the HP of particles, it becomes easier to predict greener and cheaper solvents to optimise particle formulation in terms of the content of costly stabilising additives. How does the Turbiscan technology work? Turbiscan technology is based on Static Multiple Light Scattering (SMLS), which involves sending a light source on to a sample in its native state to acquire a backscattered and transmitted signal. By repeating this measurement over time, at a user defined frequency, the Turbiscan monitors the physical stability of a sample without dilution. To compare the stability of different suspensions in a quantitative way, the Turbiscan Stability Index (TSI) can be used. The TSI is a number calculated at a time (t) by summing up all temporal and spatial variations within a considered zone. The higher the TSI value – the more unstable the product. The main advantage of using the Turbiscan technology in the Hansen approach is to discriminate in an accurate way, the tiny stability variations of solvents tested as good dispersion media; which is difficult by conventional observation. Such measurements allow the generation of a Hansen sphere, which is more precise and restrictive than the ones obtained through visual characterization of samples. How was suspension stability evaluated? The TiO2 particles were dispersed using the ultrasonic probe “Sonotrode” in 18 different solvents. Following the dispersion step, the sample was immediately samples, and its stability was measured for 30 minutes at 25 °C in a Turbiscan Tower. To “score” the different solvents, the TSI scale was used in a quantitative manner to measure the stability evolution of suspensions. Each solvent was scored from 4 when a completely unstable suspension is obtained (TSI>10), to 1 for a suspension with a high stability (TSI < 0.5) How were the selected solvents rated as a good or poor stabilisation media? Having measured the TSI values, each solvent can be scored with respect to its ability to stabilize TiO2 particles and, therefore, build the corresponding Hansen sphere. From these values obtained for the TiO2 particles and the HP of other solvents available in literature, it is easy to calculate the Relative Energy Difference (RED) and predict if the selected solvents will be a good or a poor stabilisation media. A classification of the solvent stabilization properties can be also predicted considering that the lower the RED value, the more stabilized the suspension that will be obtained. It is possible to design a mixture of solvents that highlight an even better stability, which will be much closer to the sphere centre. Summary This study with the Turbiscan technology was carried out to quantify and compare the effect of stabilisation media on the stability of different Titanium Dioxide particle suspensions. Through calculation of the TSI, different solvents were tested and classified, making this method suitable for the HP approach for predicting new stabilisation media. This method shows a direct application in predicting better stabilisation media, as well as greener and cheaper solvents to optimise particle formulation in terms of expensive stabilising additives. Since the Turbiscan technology can discriminate the stability and the dispersibility of particles, the HP approach could be also employed to characterize the dispersibility properties of solvents. To find out more about how the Turbiscan Technology can help your work, please call us on: 01442 876777 or email: sales@fullbrook.com. We can offer you a free, no obligation quote, as well as the opportunity to test some samples. 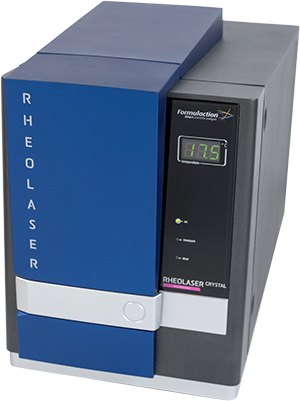 For those working in the dairy industry, Formulaction’s Rheolaser CRYSTAL can help optimise butter production by measuring the melting profiles of fresh cream samples. Fresh cream is the fatty part of milk and is made up of different triglycerides with a wide range of melting points, due to a mixture long and short chains, which can be either saturated or unsaturated. Seasonal changes in feeding directly impact this composition. When cattle are held on fresh pasture the triglycerides tend to be unsaturated, whereas when they are kept in during the winter this produces saturated triglycerides. This variability directly impacts the type of butter that can be made at certain times of the year. A higher ratio of unsaturated triglycerides leads to a reduction in the melting point of the produced butter, and this may affect its suitability for certain applications. How does the Rheolaser Crystal Work? The Rheolaser CRYSTAL operates using Diffusing Wave Spectroscopy (DWS), a multiple light scattering technique. Briefly, the motion of the microstructure is measured as function of temperature. During heating and cooling, characteristic peaks can be acquired for phase transitions, such as melting, crystallization, and polymorphic transitions. How can the Rheolaser CRYSTAL aid butter production? Let’s take, for example, a specific butter created for puff pastry. Puff pastry is made by folding the pastry several times and introducing a high melting point butter. This butter is called “Beurre AOP de tourage”, which is usually made from cream with a high ratio of saturated triglycerides during the winter months. Three batches of March cream (early, middle, and late) were studied immediately after pasteurisation. An aliquot of cream was introduced into the closed cell (~2mL) of the Rheolaser CRYSTAL and a temperature ramp of 2 °C / min was applied from 8 °C to 50 °C. A characteristic peak at 34°C can be observed for the early March cream, whereas the middle and later creams have lower transitions. This shift to lower temperatures is due to the presence of more unsaturated triglycerides, due to the cattle being put out to pasture at the beginning of the spring. The weekly monitoring of fresh pasteurized cream suggests that after the middle of March, the cream is no longer suitable for puff pastry butter. In autumn, the reappearance of the peak will indicate the possibility of making the Beurre AOP de tourage butter again. Therefore, this study shows us that the Rheolaser CRYSTAL can aid with routine measurements and determine the seasonal changes in cream. By observing the mean melting temperature of fresh cream with the Rheolaser’s highly sensitive method, an exact indication on whether to produce individual butters can be provided.
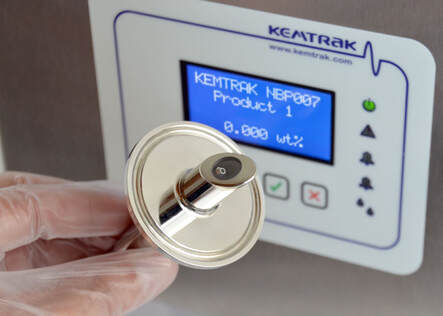
Turbiscan Applications: Optimising Vaccine Efficiency Through Separation and Flocculation Testing9/11/2021 At Fullbrook Systems, one of our most popular product ranges is the Turbiscan by Formulaction. Over the years, these instruments have been cited in hundreds of journals and peer-reviewed articles across biology, chemistry, pharmaceuticals, and engineering. This week, we focus on how the Turbiscan can help optimise vaccine efficiency via separation and flocculation testing. What are the benefits of using the Turbiscan for this purpose? Firstly, the Turbiscan provides fast and reliable migration rates. This means you can rapidly quantify particle migration rates to characterise vaccine stability and dose uniformity. You can also study the ability of the drug to redisperse under storage time or temperature conditions, and work on the sample without the need of dilution. This allows the testing of prefilled syringes or vials. All types of vaccines can be worked on with the Turbiscan, including deactivated, attenuated virus, m-RNA and toxoids. How will the Turbiscan help me with the development process? To shorten the development process, scientists need reliable characterization methods to rapidly optimize formulations with inactivated-attenuated viruses or next generation vaccines (DNA, mRNA, etc.). Vaccine efficiency depends highly on the dispersion state of the product at the moment of administration, which is why vaccines often need to be reconstituted before they can be used. Physical characterization of vaccines can be achieved by measuring the migration and flocculation rates and thus evaluate the dispersion state over time. Analysis with the Turbiscan is reliable and highly precise, enabling the optimization of the vaccine formulation. This optimisation gives enhanced dose uniformity, optimised efficiency and easy reconstitution. How does the Turbiscan technology work? The Turbiscan uses Static Multiple Light Scattering (SMLS) to detect particle migration and size variation in liquid dispersions. The Transmission (T) and Backscattering (BS) signals measured are related to particle size, and concentration, and their variation over time is a sign of destabilization. The Turbiscan® range has been used worldwide for over 25 years, to detect at an early stage all kinds of destabilizations such as coalescence, flocculation, creaming, and sedimentation. As mentioned earlier, any samples including emulsions, suspensions, dispersions, or foams can be studied at full concentration range (up to 95 %v/v) without dilution or sample preparation. Are there any other features of the Turbiscan that can help me with my vaccine development? Scientists need to consider biological, chemical, and physical challenges at each step of the process, as well as all related conditions, to maintain the product’s long shelf life. As well as the benefits outlined above, the Turbiscan can also help with: • Faster vaccine characterisation – a 24-hour visual observation can be undertaken in 30 minutes due to highly sensitive detection systems. • Boost vaccine immunogenicity through adjuvant selection and formulation adjustment. • Quickly screen a large panel of vaccine carrier molecules • Easily reconstitute and resuspend formulations for perfect dosing. • User friendly equipment - quick and easy to deploy and operate. • Create products with a long shelf life by studying your formulations under real storage conditions. How do I find out more about the Turbiscan and its vaccine stability applications? Please call us on 01442 876777 or email sales@fullbrook.com for a no obligation quote, or to discuss your requirements further.  If your research and production require accurate measurement of light scattering components, both in-line and in real time, then the Kemtrak Inline Turbidity Meter offers an ideal solution. This easy-to-use industrial process fibre optic turbidimeter contains long-life solid state LED lamps and precision fibre optics to provide drift and noise-free measurement at extremely high precision. Hassle free operation is ensured by automatic compensation of sample colour and fouling of the optical windows. The scratch resistant sapphire windows have no electronics or moving parts, making the unit appropriate for use in hazardous areas, as well as making them maintenance free. Other benefits of this popular piece of kit from Kemtrak include: • ISO 7027:1999(E) compliant • Reliable and robust infrared LED lamp • Extensive range of robust fibre optic measurement cells • Analogue output (0/4-20 mA) • Local and web based graphical user interface (TCP/IP). How does the Kemtrak Turbidity Meter work? The turbidity meter is made up of a control unit, flow cell and fibre optics, and is designed to measure the lack of clarity or “cloudiness” of a fluid caused by undissolved particles. Modern turbidimeters use a technique called nephelometry, which measures the amount of light scattered at right angles to an incident light beam. Both transmitted light and scattered light at 90° is measured and mathematically combined using a ratio algorithm to calculate the turbidity of the sample. The dual detection system and ratio algorithm then provides a turbidity measurement that has significantly better performance with coloured and/or light absorbing samples. A long-life LED light source is used to produce reliable turbidity measurements from 0.01 to over 4 000 NTU depending upon the configuration of the optical measurement cell or probe. This means the Kemtrak TC007 is an instrument of high accuracy with long-term calibration stability. What applications is the Kemtrak Turbidity Meter normally used for? The Kemtrak is typically applied in: • Filtration monitoring • Centrifuge control • Interface detection • Phase separation • Leak detection • Oil in water • Quality control To find out more about how this technology can benefit your research, production, or development, get in touch by calling: 01442 876777, or email us at: sales@fullbrook.com. 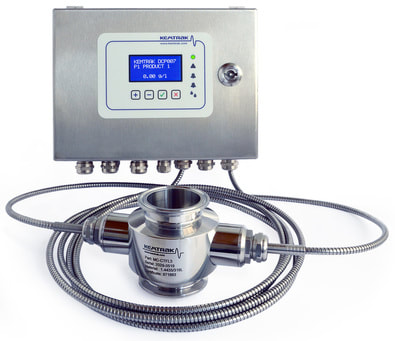 At Fullbrook Systems, we offer a range of Kreis Basket Mills that are designed for milling low-to-medium viscosity products used in the following industries: • Chemical • Pharmaceutical • Cosmetics • Marine, industrial, and leather paints • Printing inks • Protective coatings • Wood varnishes • Ceramic slurry. Kreis Basket Mills are fast-running, high-performance batch mills with variable speed adjustment using modern frequency converter technology, ideal for the fine dispersing and grinding in the batch production. When used with the Kreis Dissolver, extremely high product qualities and very short grinding times are achieved. For both processes only one production container is required, and after the pre-dispersion with the Kreis Dissolver the grinding process is carried out in the same container with the Kreis Basket Mill. As well as a laboratory pilot version, the Kreis basket mill can also be purchased with either a flat, vacuum or gas cover. The main features include: • A cover system for various container diameters • Batch sizes of 1 to 5000 litres • Fine grinding in batch production (<5 μm) • Height-adjustable grinding basket • Cooled grinding basket • Automatic cooling control Key to short production times, Kreis Basket Mills also allow for continuous temperature measurement with limit value and are optimized for operation with KREISIT® grinding beads. Other options include a double pump disc, a mixing container with a double jacket for cooling, a cleaning container, and a drain tray. To find out more about how Kreis Basket Mills can help you with your research, development, and production by contacting us today at: sales@fullbrook.com or calling: 01442 876777. 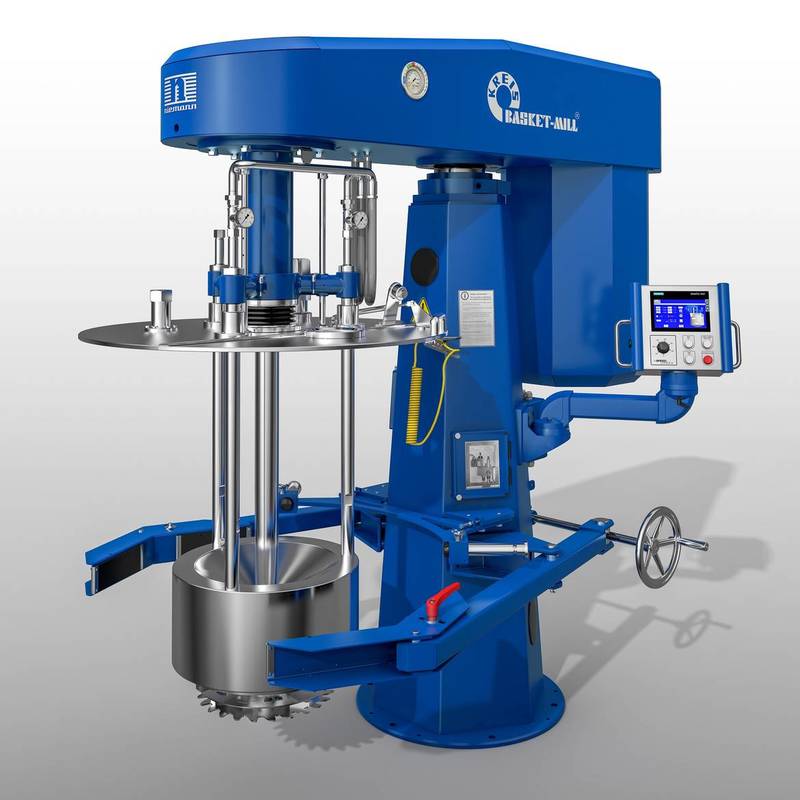 The Kemtrak NBP007 Backscatter Probe is a popular instrument that offers a great solution for: |
C HumphreysOctober 2016 Fullbrook Systems Ltd move to new premises in Hemel Hempstead. After being in the same offices for many years the company moved to more suitable premises Archives
February 2023
Categories |


 RSS Feed